
Mô tả
Chỉ báo Hỗ trợ Kháng cự Nâng cao
Khám phá sức mạnh của phân tích kỹ thuật với Chỉ báo Hỗ trợ Kháng cự Nâng cao dành cho cAlgo. Công cụ tiên tiến này được thiết kế để giúp các nhà giao dịch xác định và trực quan hóa các mức hỗ trợ và kháng cự quan trọng trên biểu đồ giao dịch của họ, nâng cao khả năng ra quyết định và chiến lược giao dịch.
Các tính năng chính:
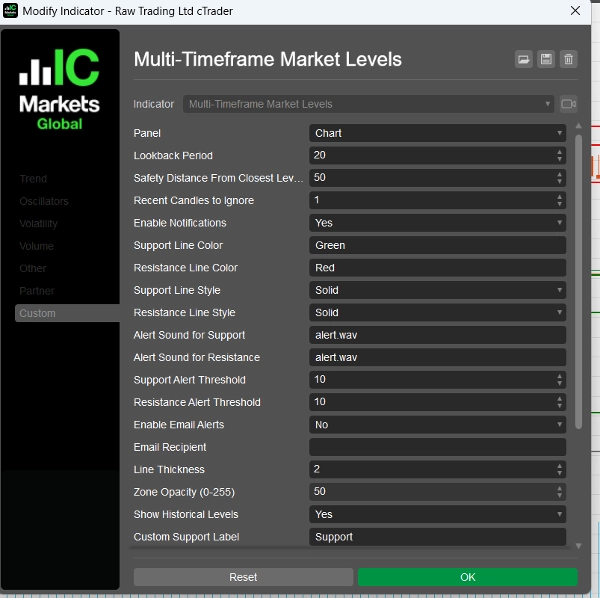
- Tham số tùy chỉnh: Tùy chỉnh chỉ báo theo phong cách giao dịch của bạn với các cài đặt điều chỉnh được, bao gồm các khoảng thời gian nhìn lại, khoảng cách an toàn, âm thanh cảnh báo và nhiều hơn nữa.
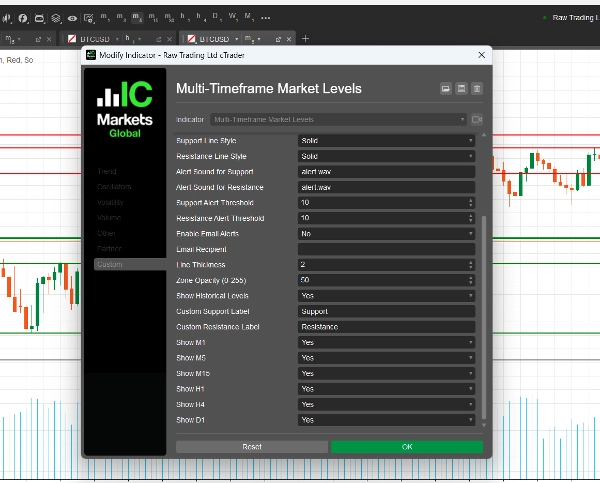
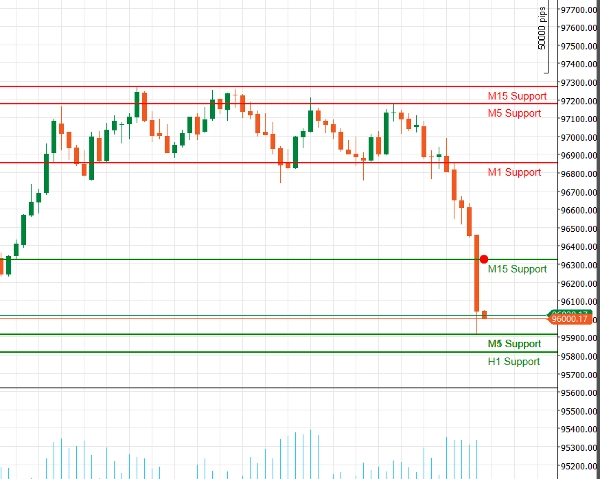
- Hỗ trợ đa khung thời gian: Phân tích nhiều khung thời gian cùng lúc (M1, M5, M15, H1, H4, D1) để có cái nhìn toàn diện về động lực thị trường và xác định các mức quan trọng trên các khoảng thời gian giao dịch khác nhau.
- Cảnh báo thời gian thực: Luôn được thông báo với các thông báo ngay lập tức! Chỉ báo có thể gửi cảnh báo âm thanh và thông báo email khi giá tiếp cận các mức hỗ trợ hoặc kháng cự quan trọng, đảm bảo bạn không bỏ lỡ cơ hội giao dịch nào.
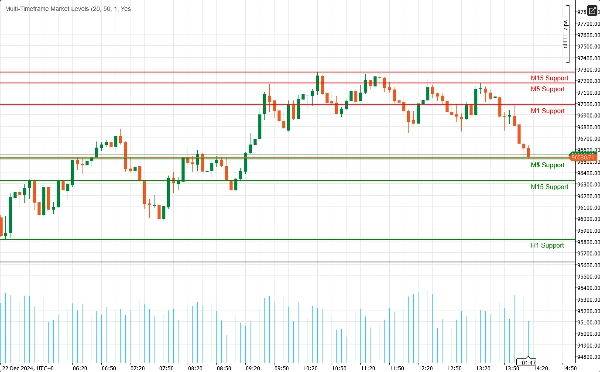
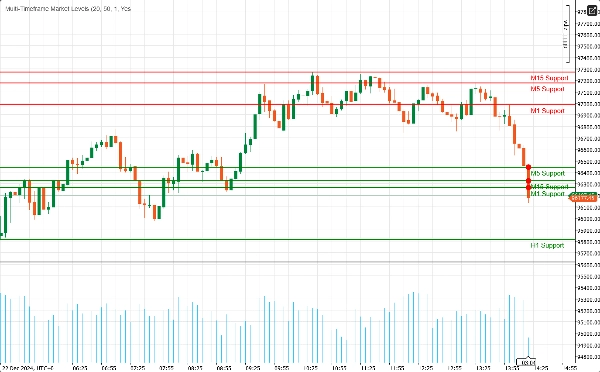
- Độ rõ ràng trực quan: Thưởng thức các biểu diễn trực quan rõ ràng của các mức hỗ trợ và kháng cự, kèm theo màu sắc và kiểu đường có thể tùy chỉnh. Các vùng được làm nổi bật cung cấp bối cảnh bổ sung, giúp dễ dàng phát hiện các điểm đảo chiều tiềm năng.
- Tích hợp Fibonacci: Nâng cao phân tích của bạn với việc vẽ các mức Fibonacci tích hợp sẵn, cho phép bạn xác định các mức thoái lui và mở rộng tiềm năng kết hợp với hỗ trợ và kháng cự.
- Giao diện thân thiện với người dùng: Được thiết kế cho cả nhà giao dịch mới và có kinh nghiệm, chỉ báo dễ dàng cài đặt và tích hợp liền mạch vào môi trường cAlgo hiện có của bạn.
Cách sử dụng Chỉ báo Hỗ trợ Kháng cự Nâng cao
- Cài đặt:
-
- Tải chỉ báo và nhập nó vào nền tảng cAlgo của bạn.
- Gắn chỉ báo vào biểu đồ bạn muốn.
- Cấu hình tham số:
-
- Điều chỉnh các cài đặt phù hợp với phong cách giao dịch của bạn. Đặt khoảng thời gian nhìn lại, khoảng cách an toàn, và chọn màu sắc cũng như kiểu đường ưa thích cho các mức hỗ trợ và kháng cự.
- Bật thông báo nếu bạn muốn nhận cảnh báo khi giá tiếp cận các mức này.
- Chọn khung thời gian:
-
- Chọn các khung thời gian bạn muốn hiển thị. Bạn có thể chọn hiển thị hoặc ẩn các mức từ M1, M5, M15, H1, H4 và D1, tùy thuộc vào chiến lược giao dịch của bạn.
- Phân tích biểu đồ:
-
- Quan sát các mức hỗ trợ và kháng cự được vẽ trên biểu đồ của bạn. Những mức này cho biết nơi giá có khả năng đảo chiều hoặc tích lũy.
Cách giao dịch với Chỉ báo Hỗ trợ Kháng cự Nâng cao
- Xác định điểm vào lệnh:
-
- Giao dịch mua: Tìm cơ hội mua khi giá tiếp cận mức hỗ trợ, đặc biệt nếu có dấu hiệu bật lại (ví dụ: các mẫu nến tăng giá).
- Giao dịch bán: Cân nhắc bán khi giá gần mức kháng cự, đặc biệt nếu có tín hiệu giảm giá (ví dụ: các mẫu nến giảm giá).
- Sử dụng cảnh báo:
-
- Sử dụng các cảnh báo thời gian thực để thông báo khi giá tiếp cận các mức hỗ trợ hoặc kháng cự chính. Điều này giúp bạn hành động nhanh chóng và tận dụng các cơ hội giao dịch tiềm năng.
- Kết hợp với các chỉ báo khác:
-
- Nâng cao chiến lược của bạn bằng cách kết hợp Chỉ báo Hỗ trợ Kháng cự Nâng cao với các chỉ báo kỹ thuật khác (ví dụ: Đường trung bình động, RSI, MACD) để xác nhận tín hiệu và cải thiện độ chính xác của các giao dịch.
- Đặt mức dừng lỗ và chốt lời:
-
- Đặt lệnh dừng lỗ ngay dưới các mức hỗ trợ cho giao dịch mua và ngay trên các mức kháng cự cho giao dịch bán để quản lý rủi ro.
- Đặt mục tiêu chốt lời tại mức hỗ trợ hoặc kháng cự quan trọng tiếp theo để tối đa hóa lợi nhuận tiềm năng.
Tại sao chọn Chỉ báo Hỗ trợ Kháng cự Nâng cao?
Điều hướng những phức tạp của thị trường tài chính có thể là một thách thức. Chỉ báo Hỗ trợ Kháng cự Nâng cao trang bị cho bạn các công cụ cần thiết để xác định các mức giá quan trọng và đưa ra quyết định giao dịch thông minh. Dù bạn là nhà giao dịch trong ngày hay nhà đầu tư dài hạn, chỉ báo này là một bổ sung thiết yếu cho bộ công cụ giao dịch của bạn.
Tóm tắt
Đánh giá của khách hàng
5 | 100 % | |
4 | 0 % | |
3 | 0 % | |
2 | 0 % | |
1 | 0 % |


