
Description
▁▂▃▄▅▆▇ █ 10 000+ traders (institutionnels + particuliers) █ ▇▆▅▄▃▂▁
- Choisissez nos meilleurs indicateurs sur cTrader 🏆
- ✨ Précision exclusive pour des résultats supérieurs ✨
- 📈 Nos algorithmes —avec les visuels les mieux notés 🎯—
- ont été implémentés avec succès dans 2 fonds quantitatifs
▁▂▃▄▅▆▇ █████████████████████████████ ▇▆▅▄▃▂▁
_______________________________________________
_______________________________________________
📌 Indicateurs de Structure de Marché
· ✅ AdvancedMarket Structure : Bos, Choch, SwinLevels, Order Blocks, Market Structure& Liquidity Finder
· 🔄 Analyse dynamique de la structure du marché des points de retournement
· 🧱 Order Block
· ⛓️ BOS & CHOCH
· 🧠 ICT Power of 3
· 🌀 Zones de polarité du marché
______________________________________________________________-
Stocker les cBots : 🧠 Gold & BTC BreakoutSession Pivots 🧠
_______________________________________________
🔚 Systèmes de sortie intelligents
· 📍 Algorithme intelligent de suivi
_______________________________________________
📐 Indicateurs ZigZag
· 🔍 Projection de liquidité des prix ZigZag
· ➖ ZigZag
· 🎯 Traceur d'extrémités Zig-Zag
_______________________________________________
🧱 Indicateurs de support et résistance
· 🟩 Lignes de support et résistance SmartTrend
· 🧱 Tous les niveaux de support et résistance
_______________________________________________
📊 Indicateurs de tendance et de canal
· 🔄 Canal de tendance automatique
· 📊 Supertrend
· ⚡Analyseur de tendance Momentum
· 🧠 Canal de tendance adaptatif
· 💥 Système de cassure de canal
· 🌈 Gradient de tendance dynamique
_______________________________________________
💧 Outils de volume et de liquidité
· 🔥 Carte thermique du volume POC
· 📉 Carte de liquidation des leviers
· 🔍 Écart de valeur équitable Momentum
· 🕒 Sessions d'écart de valeur équitable
_______________________________________________
⚡ Indicateurs Momentum & RSI
· 📈 Déclencheur de tendance RSI
· 🚀 Momentum de plage dynamique
· 🔎 Traceur de biais de chandeliers multi-niveaux
_______________________________________________
🔮 Outils de prédiction et de projection
· 📐 Prédiction basée sur Linreg & ATR
· 📏 Régression linéaire Fibonacci multi-échelles
· 📈 Projecteur de flux de marché alimenté par le volume
______________________________________________________________________________________________________
MOTEUR DE PROBABILITÉ DE RENVERSEMENT 🔄
Un indicateur hybride pour détecter les zones de retournement + cartographie multidimensionnelle des supports et résistances "Niveaux Dorés". Il combine l'analyse de structure (hauts/bas de fenêtre Fibonacci), la dynamique (vélocité et accélération des prix), l'entropie/le chaos (ordre vs désordre), le momentum et le volume pour générer :
- Niveaux hiérarchiques de support/résistance selon l'horizon temporel.
- Signaux probabilistes de retournement potentiel (pics et creux) avec un % de confiance. ⚠️
- Zones actives (rectangle) pour contextualiser les trades et les stops.
- Clusters de confluence (lorsque plusieurs temporalités coïncident au même prix). 🎯
2. Objectif
Réduire le bruit visuel et faciliter la prise de décision en identifiant :
- Où le prix a été compressé ou ancré sur différents horizons.
- Où la probabilité statistique d'un retournement augmente (confirmé ou anticipé). 📊
- Quels niveaux ont le plus grand "poids" (confluence).
3. Logique conceptuelle
a) Niveaux : Pour chaque fenêtre Fibonacci, on prend le plus haut (R) et le plus bas (S) récents ; cela fournit une échelle fractale de contextes (ultra-court à macro).
b) Fusion : Si plusieurs niveaux distincts tombent dans X pips, ils sont regroupés → un cluster avec une étiquette combinée et un compte de confluence.
c) Signaux de retournement : On recherche des motifs d'épuisement local (forme d'onde), décélération (changement de pente), chute d'entropie faible (entropie faible = mouvement plus directionnel prédisposé à inverser), divergences internes possibles, et validations momentum/volume.
d) Mode prédictif : Permet d'anticiper les retournements (diamant) avant confirmation complète si accélération contraire + faible entropie + état extrême s'alignent. 💎
e) Probabilité : Pondération normalisée de divers facteurs (tendance, chaos, momentum, volume, divergence, adaptation). Résultat tronqué 40–99%.
f) Zone active : Après un signal, on cherche la plage la plus logique (entre niveaux pertinents) pour gérer le trade et contextualiser les stops.
4. Composants visuels
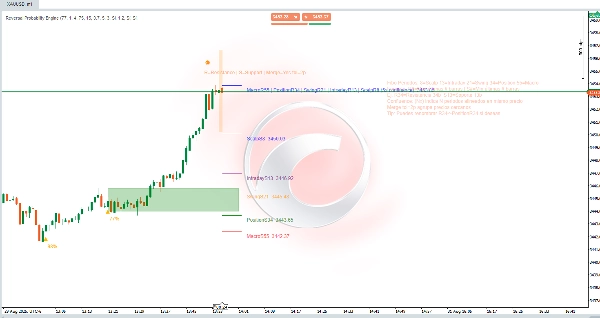
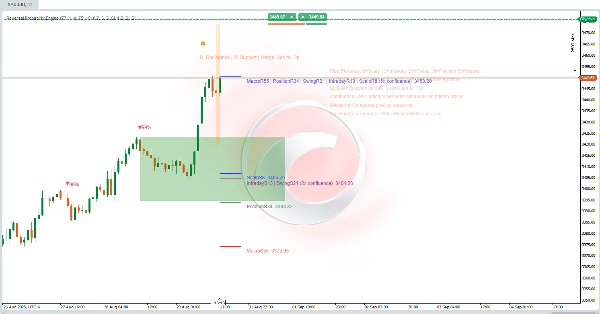
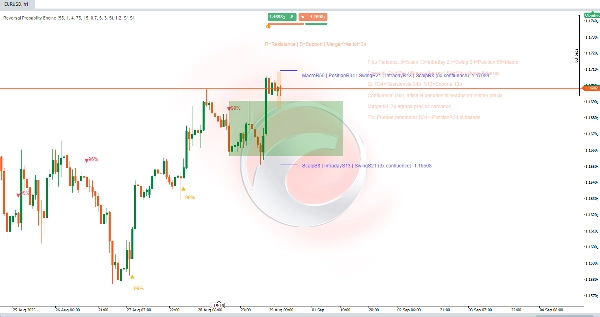
- Lignes horizontales : Niveaux par période (Scalp 8, Intraday 13, Swing 21, Position 34, Macro 55). Couleur cohérente par horizon.
- Étiquettes R#/S# : R = Résistance (plus haut récent de cette fenêtre), S = Support (plus bas récent). Ex : R34 = résistance dérivée des 34 dernières chandelles.
- Étiquettes fusionnées :
ScalpS8 | IntradayS13 | … (confluence 5x) Prix. Indique que N périodes distinctes donnent le même niveau (ou dans la tolérance). Plus il y en a, plus la pertinence est grande. ✅ - (Nx confluence) : Nombre de périodes coïncidentes.
- Tolérance de fusion = Xp : Tolérance en pips qui regroupe les niveaux proches (évite la saturation).
- Probabilités (%) : Texte au-dessus/en-dessous des triangles (Bas / Haut) ou du diamant (détection précoce).
- Rectangle vert (zone active) : Canal opérationnel dynamique où l'évolution post-signal est évaluée.
- Blocs/couleurs subtils supplémentaires : Éléments de support (ondes/particules) si activés.
5. Interprétation pratique
- Forte confluence (≥3x) = fort "aimant" ou niveau pivot ; surveillez la réaction du prix. 🧲
- Signal + confluence proche renforce la validité (mais ne garantit pas).
- Probabilité ≥ % de confiance min : Filtre minimum pour considérer l'action.
- Différencier Anticipé (diamant) vs. Confirmé (triangle) : L'anticipé offre un meilleur ratio risque/rendement, taux de faux plus élevé ; le confirmé arrive avec moins d'asymétrie mais plus de validation.
- Rectangle : Si le prix reste à l'intérieur et n'invalide pas le bord opposé, la thèse reste vivante ; une cassure nette réduit l'attente.
- Augmenter ou diminuer la tolérance de fusion : Plus petite = plus grande granularité, plus grande = clusters plus synthétisés.
6. Flux d'utilisation
- Chargez l'indicateur sur l'instrument et la période souhaités.
- Ajustez le % de confiance minimum selon la tolérance (ex. plus bas pour le scalping, plus haut pour le swing).
- Vérifiez si un cluster multiple de support/résistance apparaît (5x, 4x, etc.).
- Attendez un signal (idéal s'il survient en périphérie du cluster et avec une forte probabilité). 🔔
- Délimitez la gestion dans la zone active : entrée échelonnée ou confirmation d'une cassure ratée.
- Définissez un stop logique : au-delà du premier niveau inférieur (en long) ou supérieur (en short) non présent dans la confluence.
- Désactivez les périodes que vous n'utilisez pas (ex. seulement Swing/Macro pour les positions longues).
- Ajustez la tolérance et, éventuellement, cachez le panneau explicatif une fois appris.
7. Exemple de lecture rapide d'étiquette
ScalpS8 | IntradayS13 | SwingS21 | PositionS34 | MacroS55 (confluence 5x)
Signification : Toutes les temporalités (8–55) partagent le même plancher → support structurel multi-échelle. Probabilité plus élevée de réaction ; s'il est perdu avec volume, cela implique un changement de régime plus sérieux. 🚨
Résumé
Key features include:
- Hierarchical support and resistance levels categorized by time horizons (from ultra-short scalp to macro scales).
- Probabilistic reversal signals indicating potential peaks and valleys with confidence percentages.
- Active zones displayed as rectangles to help contextualize trade entries and stop placements.
- Confluence clusters that highlight price levels confirmed across multiple timeframes, enhancing level significance.
The indicator reduces visual noise by grouping nearby levels within a tolerance range and provides clear visual components such as horizontal lines, labeled resistance/support points, merged confluence labels, probability percentages, and active zones. It distinguishes between anticipated and confirmed reversal signals, offering traders options for risk management and trade timing.
Users can adjust confidence thresholds and merge tolerances to tailor granularity and filtering according to their trading style and timeframe. The tool supports structured decision-making by identifying statistically significant reversal areas and multi-scale support/resistance clusters on any instrument and timeframe.
Avis clients
5 | 0 % | |
4 | 0 % | |
3 | 0 % | |
2 | 0 % | |
1 | 100 % |


