
Descrizione
Indicator di Pinescriptlabs Store: 🤖Pinescriptlabs Store cBots:
SmartTrend Support & Resistance Lines Gold & BTC Breakout Session Pivots(nuovo) YieldShield" 🛡️
Dynamic Market Structure
Analisi dei Punti di Inversione
Fibonacci Linear
Regressione Multi-timeframe
Multi-Level Candle Bias
Tracker
Auto Support and
Resistance Trend Lines
All Support and
Resistance Levels
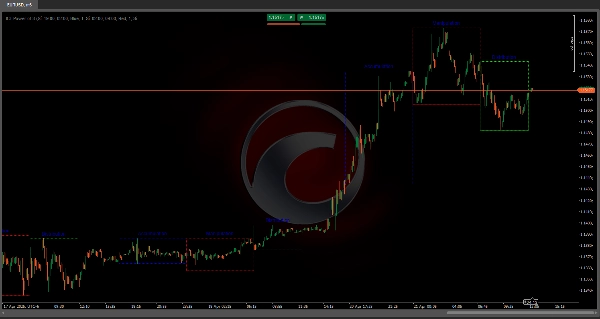
ICT POWER OF 3 ⚡📊
Questo indicatore automatizza la teoria ICT "Power of 3" tracciando tre zone chiave del mercato sul tuo grafico—Accumulo, Manipolazione e Distribuzione—usando timeframe raffinati che catturano sia le sessioni pure che le loro sovrapposizioni. Il risultato è una "mappa" 🗺️ visiva che mostra dove i grandi operatori impostano supporti, cacciano stop e guidano le tendenze—senza bisogno di analisi manuale di candele o stoppini!
Perché Questo Algoritmo è Importante nel Trading 💡
Visibilità Istituzionale 👀: Automatizzando il rilevamento delle zone dove "Smart Money" accumula, manipola e distribuisce, elimini le supposizioni e vedi immediatamente dove fluisce la liquidità reale.
Rilevamento Trappole & Liquidità 🎯: La fase di Manipolazione (sovrapposizione Europa-NY) è dove avvengono le caccia agli stop—individuarle ti permette di entrare nei trade con rischio inferiore.
Conferma del Trend 🚀: La zona pura di Distribuzione NY cattura il nucleo del momentum direzionale—operare in sincronia con esso aumenta i tassi di successo.
Coerenza 🔄: Usare timeframe fissi e visualizzazioni standardizzate elimina i bias emotivi e semplifica il backtesting.
Rilevamento delle Tre Fasi (Focus sulle Sovrapposizioni) 🔍
1️⃣ Accumulo (Asia + Sovrapposizione Tokyo/Londra: 19:00 – 2:00 EST)
- Inizio ⏳: Alla prima candela delle 19:00 EST, si apre una "scatola" che cattura il massimo/minimo iniziale.
- Monitoraggio 🔄: Se il prezzo rompe il range (nuovo massimo/minimo), la scatola si espande in tempo reale.
- Chiusura 🚪: Alle 2:00 EST, la scatola si blocca, segnando dove Smart Money ha assorbito ordini con bassa volatilità.
2️⃣ Manipolazione (Europa + Sovrapposizione Londra/NY: 2:00 – 9:00 EST)
- Inizio ⏳: Rilevato alla prima candela delle 2:00 EST.
- Comportamento 🎭: Evidenzia falsi breakout degli estremi precedenti—ogni rifiuto è tracciato visivamente.
- Chiusura 🚪: Termina alle 9:00 EST, rivelando dove si sono concentrate le caccia agli stop.
3️⃣ Distribuzione (Sessione Pura NY: 9:00 – 14:00 EST)
- Inizio ⏳: Inizia con la candela delle 9:00 EST.
- Evoluzione 📈: La scatola cresce con la tendenza più forte—dove le istituzioni rilasciano posizioni.
- Chiusura 🚪: Si conclude alle 14:00 EST, segnando la fase di massimo momentum e volume.
Gestione del Giorno & Pulizia Automatica 🧹
Per evitare l'ingombro del grafico, l'indicatore mantiene solo gli ultimi N giorni (configurabili). Una volta superato, cancella automaticamente le vecchie zone—bordi, riempimenti ed etichette—mantenendo la tua analisi pulita e focalizzata sui dati recenti.
Riepilogo
The indicator identifies:
1. Accumulation phase (7 PM – 2 AM EST, Asia + Tokyo/London overlap), marking where smart money absorbs orders with low volatility.
2. Manipulation phase (2 AM – 9 AM EST, Europe + London/New York overlap), highlighting false breakouts and stop hunts.
3. Distribution phase (9 AM – 2 PM EST, pure New York session), showing where institutions release positions during the highest momentum and volume.
ICT Power of 3 enhances trading by providing institutional visibility, trap and liquidity detection, and trend confirmation. It uses fixed timeframes and standardized visuals to reduce emotional bias and simplify backtesting. The indicator also manages chart clutter by automatically deleting old zones beyond a configurable number of days, keeping the analysis focused on recent data. It supports markets including commodities, cryptocurrencies (BTC, ETH), and symbols like BTCUSD and XAUUSD.
Recensioni dei clienti
5 | 100 % | |
4 | 0 % | |
3 | 0 % | |
2 | 0 % | |
1 | 0 % |


