
SymbolTFOverlay
Indicatore
119 download
Versione 1.0, Sep 2025
Windows, Mac
Descrizione
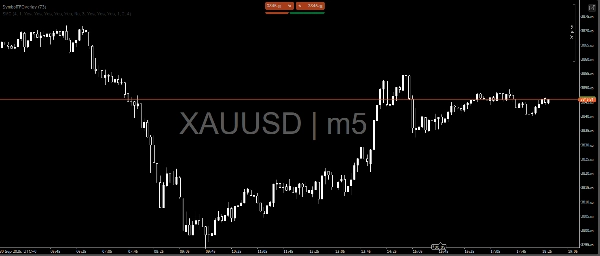
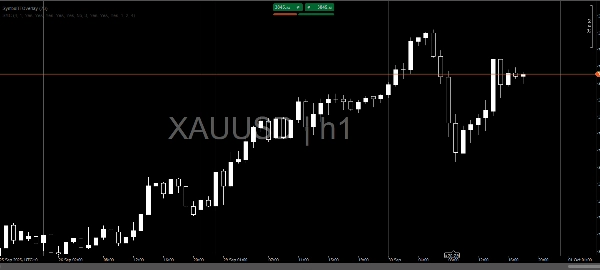
SymbolTFOverlay è un indicatore personalizzato per la piattaforma cTrader, progettato per mostrare il simbolo corrente (ad esempio, EURUSD) e il timeframe (ad esempio, H1) come sovrapposizione di testo semi-trasparente sul grafico. Questo indicatore migliora la leggibilità del grafico fornendo un riferimento visivo chiaro e centralizzato per le informazioni chiave di mercato.Caratteristiche principali:
- Visualizzazione Dinamica del Testo: Mostra il simbolo e il timeframe (ad esempio, "EURUSD | H1") al centro dell'area visibile del grafico.
- Aggiornamenti Automatici: Aggiorna il testo ogni volta che si forma una nuova barra, assicurando che rimanga centrato.
- Aspetto Personalizzabile: La dimensione del font, il colore e la trasparenza del testo possono essere liberamente personalizzati.
- Monitoraggio Efficiente: Utilizza un timer (controllo ogni 2 secondi) per rilevare cambiamenti nell'area visibile del grafico, come zoom o scorrimento, per un riposizionamento fluido del testo.
- Validazione Robusta: Include controlli per prevenire errori da indici o livelli di prezzo non validi, garantendo prestazioni affidabili in diverse condizioni di mercato.
- Design della Sovrapposizione: Visualizza il testo direttamente sul grafico senza ingombrare, mantenendo un'esperienza visiva pulita.
L'indicatore è ideale per i trader che necessitano di un accesso rapido alle informazioni su simbolo e timeframe durante l'analisi dei grafici, con regolazioni automatiche per mantenere una visibilità ottimale durante interazioni dinamiche con il grafico.
Riepilogo
Riepilogo AI
SymbolTFOverlay is a custom indicator for the cTrader platform that displays the current trading symbol and timeframe as a semi-transparent text overlay centered on the chart. It dynamically updates the displayed text with each new bar formation to ensure accuracy. The indicator automatically repositions the overlay during chart interactions such as zooming or scrolling by checking the visible area every two seconds. Users can customize the font size, color, and transparency of the text to suit their preferences. Built-in validation prevents errors from invalid data, supporting reliable performance across various market conditions. The overlay design integrates the information directly on the chart without cluttering the visual space, enhancing chart readability. This indicator supports multiple market types including Forex, Indices, Commodities, Crypto, and Stocks. It is intended for traders who require immediate, clear reference to the current symbol and timeframe during technical analysis.
Profilo indicatore
Recensioni dei clienti
0.0
Recensioni: 0
Recensioni dei clienti
Questo prodotto non ha ancora ricevuto recensioni. L'hai già provato? Fallo sapere agli altri per primo!
Discussioni
Domande frequenti
Forex
Indices
Commodities
Crypto
Stocks
I prodotti disponibili tramite cTrader Store, inclusi bot di trading, indicatori e plugin, sono forniti da sviluppatori terzi e resi disponibili esclusivamente a scopo informativo e di accesso tecnico. cTrader Store non è un broker e non fornisce consulenze in materia di investimento, raccomandazioni individualizzate o garanzie di risultati futuri.


Prezzo
Da 26/09/2025
119
Installazioni gratuite