
Descrizione
Sistema di Trailing Adattivo 🚀
Il Sistema di Trailing Adattivo è uno stop trailing adattivo avanzato che utilizza volatilità normalizzata logaritmica per regolare automaticamente i livelli di protezione del profitto. 📊 A differenza dei trailing stop tradizionali con distanze fisse, questo sistema calcola distanze dinamiche basate sulla volatilità reale del mercato, adattandosi costantemente alle condizioni mutevoli. 🔄
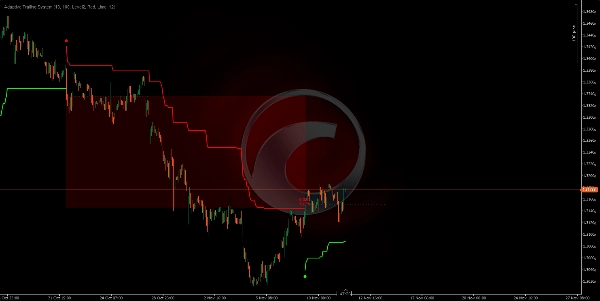
Spotware GBPUSD 691360763c684 | cTrader
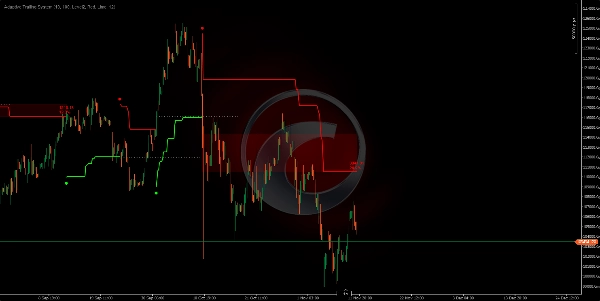
Spotware XAUUSD 691360adf1386 | cTrader
Spotware XAUUSD 691360adf1386 | cTrader
Algoritmo Unico di Trailing Adattivo ⚙️
Il sistema utilizza un metodo statistico che non genera mai le stesse distanze di trailing:
• Calcola il True Range del prezzo su un periodo configurabile.
• Applica una trasformazione logaritmica a questi valori per normalizzare la distribuzione.
• Calcola la media e la deviazione standard di questi valori logaritmici.
• Genera una distanza offset unica basata sui livelli di volatilità (0, 1, 2 o 3 deviazioni standard). 🎯
• Lo stop trailing viene continuamente regolato usando il prezzo tipico (media di High, Low, Close).
Risultato: Ogni momento di mercato ha la sua distanza di trailing, calcolata secondo la volatilità specifica di quel contesto. 🤖
Fondamento Tecnico: Volatilità Normalizzata Logaritmica 🧠
Perché una trasformazione logaritmica? 🤔
La volatilità di mercato non segue una distribuzione normale (Gaussiana); tende ad avere valori estremi. La trasformazione logaritmica:
- Normalizza la distribuzione: Converte dati asimmetrici in una distribuzione più simmetrica.
- Stabilizza la varianza: Riduce l'impatto di picchi estremi di volatilità.
- Permette il confronto statistico: Rende possibile usare la deviazione standard in modo significativo.
Processo di Calcolo dell'Offset 🔢
- True Range del Periodo: Misura la gamma massima, considerando l'High-Low del periodo e i gap con la chiusura precedente.
- Logaritmo Naturale: Applica
ln(True Range)per normalizzare. - Finestra di Normalizzazione: Mantiene gli ultimi N valori logaritmici (periodo di normalizzazione).
- Media Logaritmica: Media di tutti i
ln(TR)valori nella finestra. - Deviazione Standard: Calcola la dispersione dei valori logaritmici.
- Livello di Volatilità: Moltiplica la deviazione per 0, 1, 2 o 3 in base alla configurazione.
- Offset Finale:
Offset = e^(media + livello × deviazione)- converte di nuovo nella scala del prezzo. 💡
Come Funziona? ⚡
Meccanica di Trailing Bidirezionale
Il sistema opera in due modalità alternate:
Modalità RIBASSISTA (Short): 📉
• Lo stop trailing è posizionato SOPRA il prezzo.
• Si aggiorna verso il basso quando il prezzo scende (mai verso l'alto).
• Segnale di inversione quando il prezzo CHIÚDE sopra lo stop trailing.
Modalità RIALZISTA (Long): 📈
• Lo stop trailing è posizionato SOTTO il prezzo.
• Si aggiorna verso l'alto quando il prezzo sale (mai verso il basso).
• Segnale di inversione quando il prezzo CHIÚDE sotto lo stop trailing.
Segnali di Inversione:
• Un punto circolare indica il cambio di tendenza (entrata di una nuova posizione).
• Colore verde = Nuova tendenza rialzista (). ✅
• Colore rosso = Nuova tendenza ribassista (). 🔴
Parametri e Impatto 🎛️
Periodo di Calcolo (10)
- Funzione: Definisce quante barre vengono usate per calcolare il True Range.
- ↑ Più alto (20-50): Misura la volatilità a lungo termine, più fluida, meno sensibile.
- ↓ Più basso (5-8): Misura la volatilità a breve termine, più reattiva, rileva cambiamenti rapidi.
Periodo di Normalizzazione (100)
- Funzione: Finestra di valori logaritmici per calcolare media e deviazione standard.
- ↑ Più alto (200-500): Normalizzazione più stabile, cambiamenti graduali nell'offset.
- ↓ Più basso (50-80): Normalizzazione più reattiva, offset si adatta più rapidamente.
- Impatto Critico: Questo parametro determina quanto il contesto storico della volatilità è "memorizzato". 🧠
Livello di Volatilità (Livello 2)
- Funzione: Numero di deviazioni standard applicate al calcolo dell'offset.
- Livello 0 (0σ): Offset = media logaritmica = distanza più stretta, massima sensibilità. 🎯
- Livello 1 (1σ): Offset include 1 deviazione = distanza moderata, cattura ~68% della variazione.
- Livello 2 (2σ): Offset include 2 deviazioni = distanza più ampia, cattura ~95% della variazione (bilanciato). ⚖️
- Livello 3 (3σ): Offset include 3 deviazioni = distanza molto ampia, cattura ~99% della variazione, massima tolleranza. 🛡️
___________________________________________________________________________________________________
🚀 Oltre 10.000 trader usano già i nostri migliori indicatori🏆
👉 Ottieni tutti i nostri sistemi TOP qui:
_______________________________________________
📌 Indicatori di Struttura di Mercato
· ✅ AdvancedMarket Structure: Bos, Choch, SwinLevels, Order Blocks, Market Structure& Liquidity Finder
· 🔄 Dynamic Market StructureAnalysis of Turning Points
· 🧱 Order Block
· ⚖️ Market Imbalance
· ⛓️ BOS & CHOCH
· 🧠 ICT Power of 3
_______________________________________________
🔚 Sistemi di Uscita Intelligenti
_______________________________________________
📐 Indicatori ZigZag
· 🔍 ZigZag Price LiquidityProjection
· ➖ ZigZag
_______________________________________________
🧱 Indicatori di Supporto e Resistenza
· 🟩 SmartTrend Support &Resistance Lines
· 🧱 All Support and ResistanceLevels
_______________________________________________
📊 Indicatori di Trend e Canale
· 📊 Supertrend
_______________________________________________
💧 Strumenti di Volume e Liquidità
_______________________________________________
⚡ Indicatori di Momentum e RSI
· 🔎 Multi-Level Candle Bias
Tracker
_______________________________________________
🔮 Strumenti di Predizione e Proiezione
· 📐 Predizione Basata su Linreg& ATR
· 📏 Fibonacci Linear RegressionMulti-timeframe
· 📈 Volume-Powered Market Flow Projector_________________________________________________________________________________________________
Riepilogo
The system operates bidirectionally with two modes:
- Bearish (short) mode places the trailing stop above the price, adjusting downward as price falls, signaling a reversal when price closes above the stop.
- Bullish (long) mode places the trailing stop below the price, adjusting upward as price rises, signaling a reversal when price closes below the stop.
Reversal signals are visually marked with colored dots indicating trend changes (green for bullish, red for bearish). Key parameters include the calculation period for True Range, normalization period for volatility data, and volatility level defining the offset distance based on standard deviations.
This indicator supports various markets including Forex, cryptocurrencies, commodities, indices, and stocks, with symbols such as BTCUSD, EURUSD, GBPUSD, XAUUSD, NAS100, and USDJPY. It is designed to provide adaptive trailing stops that respond to real-time volatility, enhancing trade exit strategies.


![Logo di "[Stellar Strategies] Market Session Ultimate"](https://cdn.ctrader.com/image/webp/61ffd537-0125-4246-9e72-42eca1791d64_28232)


