Descrizione
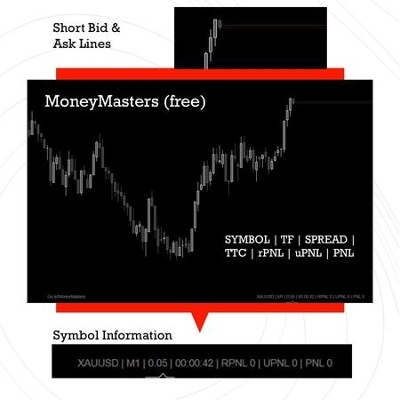
MoneyMasters - Indicatore HTF Bars
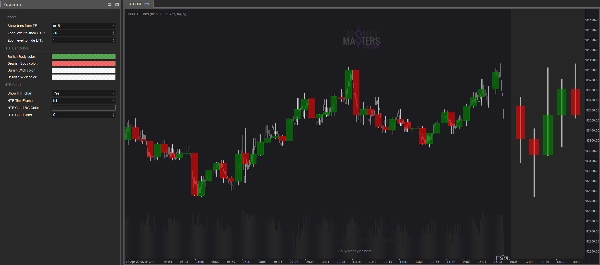
Eleva la tua esperienza di trading con il Indicatore MM-HTF Bars, uno strumento potente progettato per cTrader che sovrappone senza soluzione di continuità i dati delle candele di timeframe superiore (HTF) sul tuo grafico attuale. Questo indicatore fornisce una chiara rappresentazione visiva dell'azione del prezzo HTF, aiutandoti a prendere decisioni di trading più informate combinando più timeframe in una sola vista.
Caratteristiche principali:
- Timeframe personalizzabile: Scegli il timeframe superiore (ad esempio, 15 minuti, 1 ora) da visualizzare direttamente sul tuo grafico.
- Controllo zoom dinamico: Nascondi o mostra automaticamente le barre HTF e di timeframe inferiore (LTF) in base al livello di zoom del tuo grafico per un'esperienza senza ingombri.
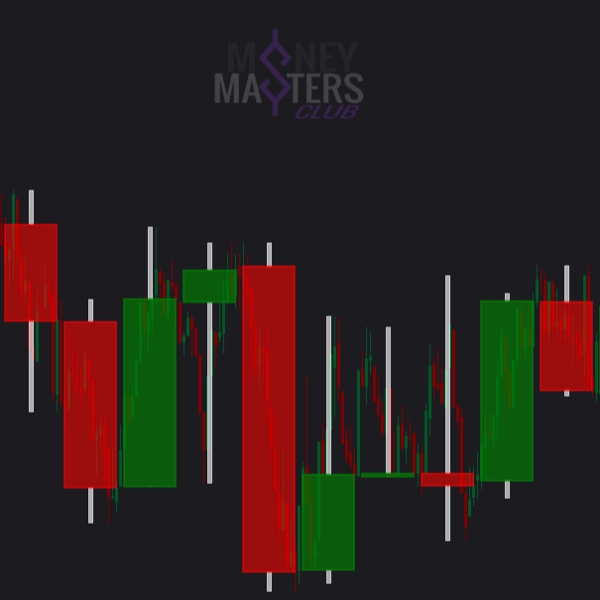
- Candele codificate a colori: Distingui facilmente tra candele HTF rialziste e ribassiste con colori personalizzabili per corpo e stoppino.
- Visualizzazione precisa: Mostra i livelli di apertura, massimo, minimo e chiusura HTF con un allineamento accurato alla timeline del tuo grafico.
- Integrazione senza soluzione di continuità: Funziona come sovrapposizione, garantendo che il tuo grafico rimanga pulito e facile da leggere.
Vantaggi:
- Ottieni una comprensione più profonda delle tendenze di mercato analizzando l'azione del prezzo HTF insieme ai dati LTF.
- Migliora la tua strategia di trading identificando i livelli chiave di supporto e resistenza HTF.
- Risparmia tempo e fatica eliminando la necessità di passare tra più grafici.
Che tu sia uno scalper, day trader o swing trader, il Indicatore MM-HTF Bars è uno strumento essenziale per migliorare la tua analisi di mercato e il processo decisionale.
Inizia a fare trading in modo più intelligente oggi!
----------
Aggiornamento 1.02 / 25041201:
- MINI GRAFICO HTF - ora mostra un mini grafico sul lato destro con candele HTF. Puoi scegliere un TimeFrame diverso e il numero di candele da mostrare.
----------
Aggiornamento 1.01 / 25040901:
- Funzionamento più fluido - ora l'indicatore si aggiorna al cambio di zoom, non ad ogni tick.
- L'indicatore può cambiare le candele in pausa in Market Reply.
Riepilogo
Recensioni dei clienti
5 | 100 % | |
4 | 0 % | |
3 | 0 % | |
2 | 0 % | |
1 | 0 % |