
PDHL
Indicatore
1.84K download
Versione 1.0, Sep 2024
Windows, Mac
2.5
Recensioni: 2
Descrizione
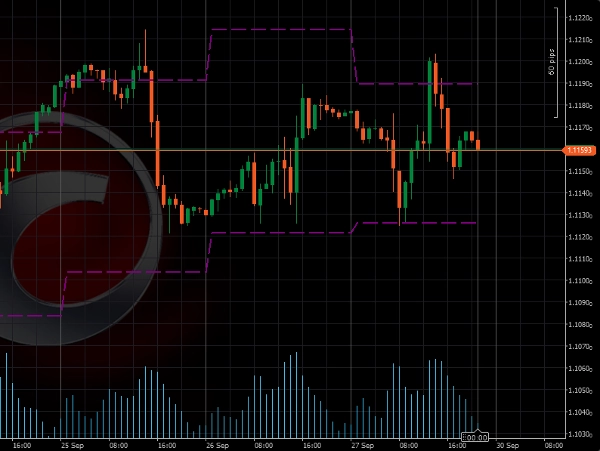
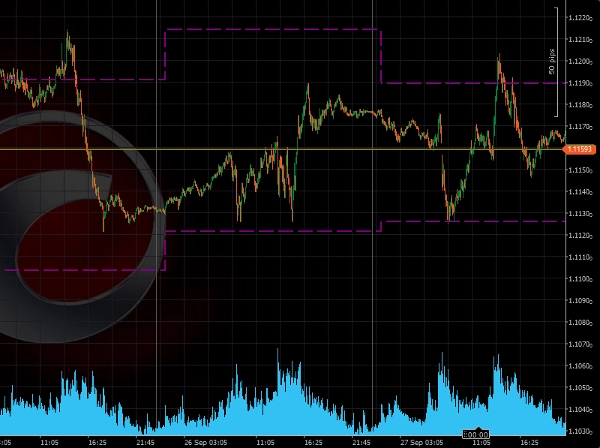
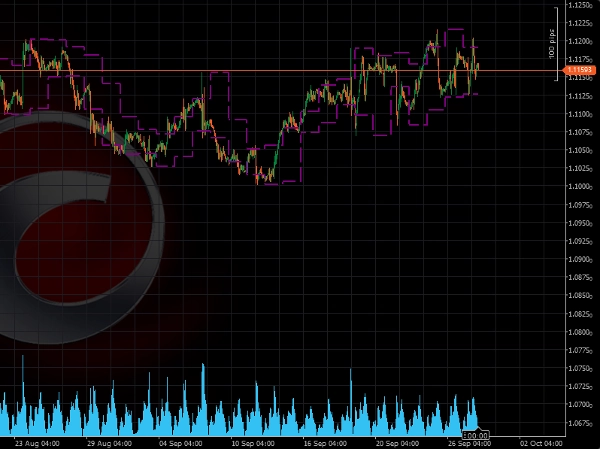
Presentazione dell'Indicatore di Trading High-Low
Questo indicatore è progettato per tracciare automaticamente i livelli di prezzo più alti e più bassi del giorno precedente sul tuo grafico. Questo strumento ti aiuta a identificare rapidamente i livelli chiave per potenziali rotture e inversioni.
Vantaggi principali:
- Ideale per il Trading di Rottura: questo indicatore evidenzia livelli di prezzo critici del giorno precedente, spesso utilizzati come punti di riferimento per strategie di breakout. Fare trading sulle rotture sopra o sotto questi livelli può offrire configurazioni ad alto potenziale.
- Semplice ma Efficace: l'Indicatore di Trading High-Low si concentra su uno degli aspetti più importanti dell'azione del prezzo – il massimo e il minimo del giorno precedente. Incorporando questi livelli nella tua strategia, ottieni una visione più chiara della struttura del mercato e dei potenziali punti di svolta.
Attenzioni:
- Da utilizzare preferibilmente su timeframe inferiori a 1 giorno
Impostazioni:
- Includi la domenica: predefinito = no
Riepilogo
Riepilogo AI
The PDHL (Previous Day High & Low) indicator automatically plots the prior day's highest and lowest price levels on trading charts. It is designed to assist traders in identifying key price levels that may signal potential breakouts or reversals. By highlighting these critical levels, the indicator supports breakout trading strategies, providing reference points for entering trades when price moves above or below the previous day's range. The tool emphasizes simplicity and effectiveness by focusing on essential price action elements, helping traders better understand market structure and potential turning points. It is best used on intraday timeframes shorter than one day. A configurable setting allows users to include or exclude Sunday in the calculation, with the default setting excluding it.
Profilo indicatore
Recensioni dei clienti
2.5
Recensioni: 2
5 | 0 % | |
4 | 0 % | |
3 | 50 % | |
2 | 50 % | |
1 | 0 % |
Recensioni dei clienti
October 9, 2025
What Timezone is it in at default? It seems to fail to get the accurate Highs and lOws for different istruments. You could add that as a customisable input. Please add closing price too
July 9, 2025
Pros: Simple and clear display of previous day's high/low levels. Stable performance. Easy to use and customize. Cons: No breakout alerts. No visual zone fill option. Lacks additional filters or Fibo levels.
Discussioni
Domande frequenti
Breakout
I prodotti disponibili tramite cTrader Store, inclusi bot di trading, indicatori e plugin, sono forniti da sviluppatori terzi e resi disponibili esclusivamente a scopo informativo e di accesso tecnico. cTrader Store non è un broker e non fornisce consulenze in materia di investimento, raccomandazioni individualizzate o garanzie di risultati futuri.
Altro da questo autore


Prezzo
Da 24/09/2024
4.46K
Installazioni gratuite