
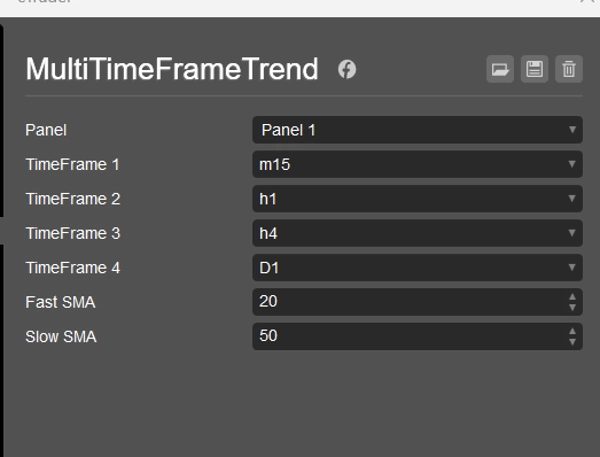
Multi Timeframe Trend Dots adalah penunjuk arah aliran yang kuat dan minimalis yang dibina untuk cTrader. Ia membolehkan pedagang menjejaki arah aliran secara visual merentasi sehingga 4 jangka masa yang boleh dipilih menggunakan garis titik berwarna yang mudah tetapi berkesan.
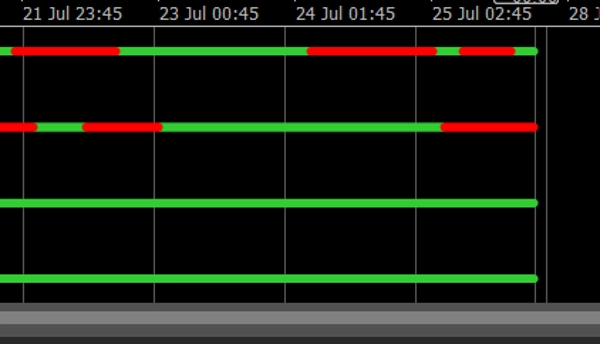
✅ Hijau = Aliran menaik
✅ Merah = Aliran menurun
✅ Susun atur kemas dalam satu sub-tetingkap
✅ Boleh disesuaikan tetapan SMA pantas/perlahanan
✅ Berfungsi pada mana-mana simbol dan jangka masa
Sama ada anda seorang scalper, pedagang intrahari, atau pedagang ayunan, penunjuk ini memberi anda pandangan pantas tentang penjajaran pelbagai jangka masa — sesuai untuk membuat kemasukan dengan yakin atau menapis persediaan yang buruk.
💼 Termasuk:
- Logik aliran berdasarkan persilangan SMA
- Penempatan titik 4 tahap (disesuaikan untuk kebolehbacaan)
- Label jangka masa di hujung setiap garis aliran
- Serasi sepenuhnya dengan semua versi cTrader
🎁 Teman sempurna untuk membina strategi atau perdagangan manual.
5 | 0 % | |
4 | 100 % | |
3 | 0 % | |
2 | 0 % | |
1 | 0 % |


![Logo "[Stellar Strategies] Market Session Ultimate"](https://cdn.ctrader.com/image/webp/61ffd537-0125-4246-9e72-42eca1791d64_28232)


