
Mô tả
🌐 Thay Đổi Cấu Trúc Thị Trường – Bộ Dao Động Cấu Trúc Thị Trường Chuyên Nghiệp
Xác Định Hướng Xu Hướng Thực Sự. Lọc Nhiễu. Giao Dịch Với Sự Tự Tin.
Thay Đổi Cấu Trúc Thị Trường là một bộ dao động xu hướng cấu trúc thế hệ tiếp theo được xây dựng cho các nhà giao dịch muốn sự rõ ràng, chính xác và đáng tin cậy trong mọi điều kiện thị trường.
Thay vì dựa vào các đường trung bình động trễ hoặc công cụ dựa trên biến động, chỉ báo này tập trung vào cốt lõi của hành vi giá: đỉnh xoay và đáy xoay.
Kết quả là một mô hình xu hướng sạch sẽ, phản hồi nhanh giúp bạn ngay lập tức nhận biết:
- Định hướng thị trường thực sự
- Chuyển đổi cấu trúc
- Sức mạnh tiếp tục xu hướng
- Sự thay đổi động lực ẩn
Dù bạn giao dịch swing, giao dịch trong ngày hay vận hành các hệ thống thuật toán, Thay Đổi Cấu Trúc Thị Trường mang đến một khung cấu trúc chuyên nghiệp trực tiếp vào biểu đồ của bạn.
🔥 Tại Sao Cấu Trúc Thị Trường Quan Trọng
Hầu hết các chỉ báo phân tích giá sau khi nó đã di chuyển.
Cấu trúc thị trường hoạt động khác biệt — nó đo lường nền tảng của sự phát triển xu hướng:
- Đỉnh Cao Hơn / Đáy Cao Hơn → Cấu trúc tăng
- Đỉnh Thấp Hơn / Đáy Thấp Hơn → Cấu trúc giảm
Điều này tiết lộ hướng mà thị trường đang xây dựng, không chỉ là những gì giá đang làm từng khoảnh khắc.
Thay Đổi Cấu Trúc Thị Trường tự động hóa toàn bộ quá trình này và biến nó thành một bộ dao động dễ đọc.
📊 Chỉ Báo Hiển Thị Những Gì
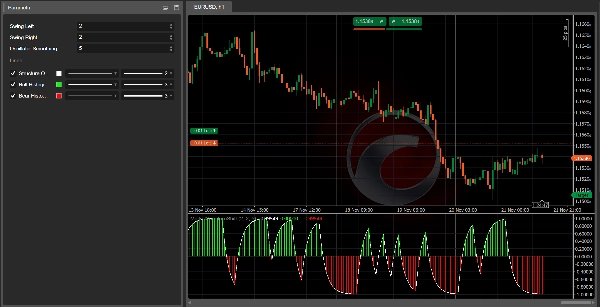
✔ 1. Đường Dao Động Cấu Trúc (Màu Trắng)
Một đường xu hướng dựa trên EMA được làm mượt rõ ràng hiển thị cấu trúc chi phối:
- Trên 0 → Cấu trúc tăng
- Dưới 0 → Cấu trúc giảm
- Gần 0 → Cấu trúc không ổn định hoặc chuyển đổi xu hướng
Chỉ cần nhìn thoáng qua là biết thị trường thực sự đang đứng ở đâu.
✔ 2. Biểu Đồ Thanh Tăng (Màu Xanh Lá)
Hiển thị sức mạnh và động lực bên trong cấu trúc tăng.
Thanh mạnh hơn = áp lực tăng mạnh hơn.
Hoàn hảo để xác nhận các thiết lập mua dài.
✔ 3. Biểu Đồ Thanh Giảm (Màu Đỏ)
Hiển thị động lực và sức mạnh của cấu trúc giảm.
Thanh mạnh hơn = xu hướng giảm mạnh hơn.
Lý tưởng để xác nhận các cơ hội bán ngắn.
🎯 Cách Các Nhà Giao Dịch Sử Dụng Nó (Quy Trình Chuyên Nghiệp)
A. Bộ Lọc Xác Nhận Xu Hướng
Chỉ giao dịch theo hướng động lực cấu trúc:
- Giao dịch mua khi bộ dao động trên 0
- Giao dịch bán khi bộ dao động dưới 0
Quy tắc đơn giản này giúp loại bỏ nhiều thiết lập sai.
B. Phát Hiện Đảo Chiều Cấu Trúc
Các chuyển đổi lớn có thể nhìn thấy khi bộ dao động cắt qua đường số không:
- Đỏ → Xanh = Cấu trúc tăng mới
- Xanh → Đỏ = Cấu trúc giảm mới
Điều này cung cấp cái nhìn sớm về sự thay đổi xu hướng trước khi các công cụ truyền thống phản ứng.
C. Tối Ưu Đa Khung Thời Gian
Chỉ báo đặc biệt mạnh trong các quy trình làm việc đa khung thời gian:
- Sử dụng H4/H1 cho khung xu hướng
- Sử dụng M30/M15 cho điểm vào lệnh
Ngăn chặn giao dịch ngược xu hướng và tối đa hóa độ chính xác.
D. Tương Tác Với Tín Hiệu Cấu Trúc Thị Trường
Thay Đổi Cấu Trúc Thị Trường trở thành một hệ thống giao dịch hoàn chỉnh khi kết hợp với Tín Hiệu Cấu Trúc Thị Trường, cung cấp:
- Mũi tên MUA/BÁN
- Các dấu hiệu chuyển đổi trực quan
- Cảnh báo phá vỡ cấu trúc
Cùng nhau, chúng tạo ra một phương pháp luận dựa trên cấu trúc toàn diện từ trên xuống.
⚙️ Thiết Kế Cho Mọi Thị Trường
✔ Forex
✔ Chỉ số
✔ Tiền điện tử
✔ Kim loại
✔ Thị trường tổng hợp
✔ Hợp đồng tương lai (qua các đại diện CFD)
Rất linh hoạt nhờ kiểm soát tham số về:
- Phát hiện swing
- Độ mạnh làm mượt
- Độ nhạy với thay đổi cấu trúc
📈 Cài Đặt Đề Xuất
- Swing Trái/Phải: 2–3 cho Forex và Chỉ số, 3–3 cho Tiền điện tử
- Làm Mượt Bộ Dao Động: 5–8 để cân bằng độ phản hồi
Được xây dựng để sử dụng ngay, nhưng hoàn toàn có thể tùy chỉnh.
💬 Tham Gia Cộng Đồng Của Chúng Tôi Để Nhận Công Cụ & Tối Ưu Miễn Phí
Nhấp vào liên kết trong hồ sơ của tôi để tham gia cộng đồng giao dịch của chúng tôi, nơi bạn sẽ tìm thấy:
- Bộ tham số được tối ưu hóa
- Công cụ bổ sung
- Chiến lược dựa trên cấu trúc
- Tài nguyên độc quyền cho các chỉ báo AlgoTrend
Một không gian tuyệt vời để phát triển hệ thống của bạn và cải thiện sự nhất quán.
Tóm tắt
Traders use Market Structure Shift for trend confirmation by trading only in the direction of structural momentum, detecting structural reversals via zero-line crossings, and optimizing multi-timeframe workflows (e.g., H4/H1 for trend framework, M30/M15 for entries). It integrates with Market Structure Signals to provide buy/sell arrows, visual shift markers, and structural break alerts, forming a comprehensive structure-based trading system.
The indicator supports multiple markets including Forex, indices, cryptocurrencies, metals, synthetic markets, and futures (via CFDs). It offers customizable parameters for swing detection, smoothing, and sensitivity to structural changes, enabling adaptability across different asset classes and trading styles.
Đánh giá của khách hàng
5 | 0 % | |
4 | 100 % | |
3 | 0 % | |
2 | 0 % | |
1 | 0 % |


