
HA
Indicador
2 compras
Versão 1.0, Jan 2026
Windows, Mac
4.0
Avaliações: 1
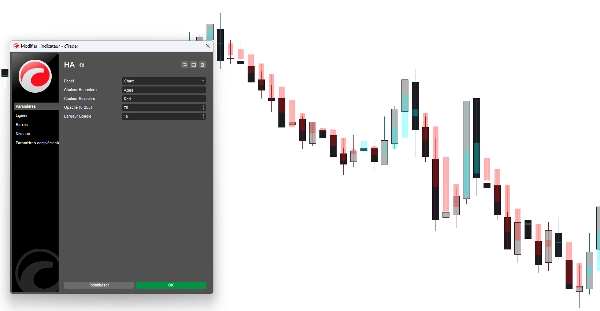
Descrição
O Pro Heikin Ashi Visual Overlay é a ferramenta perfeita para traders que desejam os benefícios de suavização de tendência das velas Heikin Ashi enquanto mantêm seus gráficos padrão de velas ou barras ativos.
Os gráficos tradicionais Heikin Ashi exigem que você mude todo o tipo de gráfico, dificultando a visualização da ação exata do preço. Este indicador resolve isso desenhando velas Heikin Ashi como uma sobreposição semi-transparente, permitindo que você identifique reversões de tendência e o momentum do mercado instantaneamente sem perder de vista o preço real.
Por que usar esta Sobreposição?
- 💎 Redução de Ruído: Heikin Ashi filtra o ruído do mercado, facilitando permanecer em trades vencedores.
- 🕯️ Visualização Dupla de Gráfico: Mantenha suas velas padrão para ação/padrões de preço enquanto usa a sobreposição HA para direção da tendência.
- 🎨 Totalmente Personalizável: Ajuste a opacidade e as cores para combinar com seu espaço de trabalho (modo Escuro ou Claro).
- 🚀 Identificação Instantânea de Tendência: Zonas Azul (Altista) e Vermelha (Baixista) ajudam você a evitar operar contra o momentum.
Principais Características:
- Transparência Inteligente: Defina a opacidade para que a sobreposição não esconda sua ação principal de preço.
- Alinhamento Perfeito: Calculado em tempo real para corresponder aos valores Heikin Ashi do timeframe atual.
- Design Profissional: Visuais limpos que não poluem seu gráfico.
- Universal: Funciona em todos os timeframes (M1 a Mensal) e todos os ativos (Forex, Ações, Cripto, Índices).
Como usar:
- Aplique o indicador ao seu gráfico.
- Ajuste a Opacidade e a Largura do Corpo nas configurações conforme sua preferência.
- Use as velas HA para confirmar a força da tendência:
-
- Pavios longos na direção da tendência = Momentum Forte.
- Corpos pequenos com pavios em ambos os lados = Potencial Reversão.
Parâmetros:
- Cor Altista: Cor personalizada para velas HA ascendentes.
- Cor Baixista: Cor personalizada para velas HA descendentes.
- Opacidade (0-255): Controle o quão "fantasmagóricas" ou sólidas as velas aparecem.
- Largura da Vela: Ajuste a espessura das velas HA para se encaixar perfeitamente no seu nível de zoom.
Resumo
Resumo de IA
The Pro Heikin Ashi Visual Overlay is an indicator designed to enhance trend analysis by overlaying Heikin Ashi candles on standard candlestick or bar charts. Unlike traditional Heikin Ashi charts that replace the entire chart type, this tool provides a semi-transparent overlay, allowing traders to observe smoothed trend signals while retaining visibility of actual price action.
Key features include noise reduction to filter market fluctuations, customizable opacity and colors for integration with different chart backgrounds, and real-time alignment with the current timeframe’s Heikin Ashi calculations. The overlay uses blue and red zones to indicate bullish and bearish trends, aiding in immediate trend identification. It supports all timeframes from one minute to monthly and is compatible with various asset classes including Forex, stocks, cryptocurrencies, commodities, and indices.
Users can adjust candle width and opacity to suit their chart zoom level and visual preferences. The indicator facilitates dual-chart viewing, enabling simultaneous analysis of precise price patterns and smoothed trend momentum. It is designed with clean visuals to avoid chart clutter and supports professional trading environments.
Perfil do indicador
Avaliações de clientes
4.0
Avaliações: 1
5 | 0 % | |
4 | 100 % | |
3 | 0 % | |
2 | 0 % | |
1 | 0 % |
Conversa
Perguntas frequentes
Forex
Signal
Indices
Commodities
Crypto
Stocks
Os produtos disponíveis através da cTrader Store, incluindo bots de negociação, indicadores e plugins, são fornecidos por programadores terceiros e são disponibilizados apenas para fins informativos e de acesso técnico. A cTrader Store não é um corretor e não fornece aconselhamento em matéria de investimento, recomendações pessoais ou qualquer garantia de desempenho no futuro.
Mais deste autor


Preço
Desde 27/10/2025
10
Vendas