
FVG & Imbalance Detector
インジケーター
2 購入済
バージョン 1.0、Jan 2026
Windows、Mac
4.0
レビュー: 2
説明
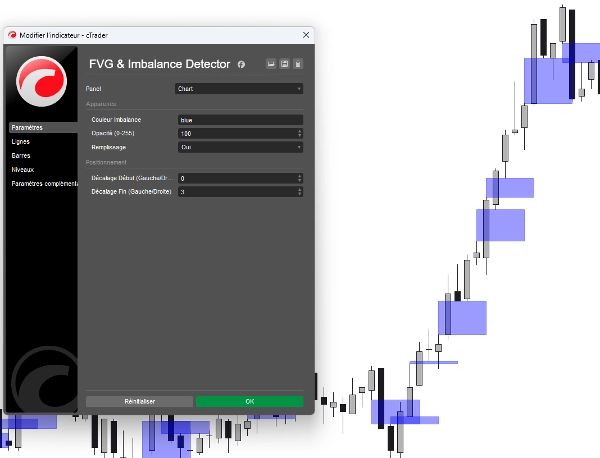
スマートマネーコンセプト(SMC)(Smart Money Concepts (SMC))とICTの世界では、価格の不均衡は大手機関投資家の「指紋」です。市場が急速に動くと、価格はほぼ必ず「埋める」または再テストするための非効率ゾーンであるフェアバリューギャップ(FVG)を残します。
cTrader用のFVG & Imbalance Detectorは、これらの非効率を自動的に検出する高性能ツールです。手動で描画する必要はなく、チャート上に明確で実用的なゾーンを直接表示します。
このインジケーターが必須である理由:
- 🚀 機関投資家の動きを捉える: 大手銀行やヘッジファンドが大量の取引量で市場に参入した場所を確認できます。
- 🎯 高確率ゾーン: 特定された不均衡を利益確定の磁石のようなターゲットや、精密なエントリーのための「ゴールデンゾーン」として利用します。
- 📈 クリーンな視覚化: トレンド分析を容易にする高品質の長方形オーバーレイ。
- 🔧 完全な柔軟性: 基本的なインジケーターとは異なり、このバージョンではゾーンを未来に延長したり、特定の戦略に合わせて開始点を調整したりできます。
独自の機能:
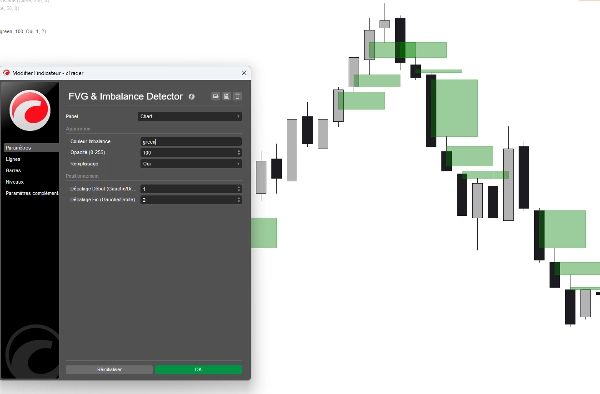
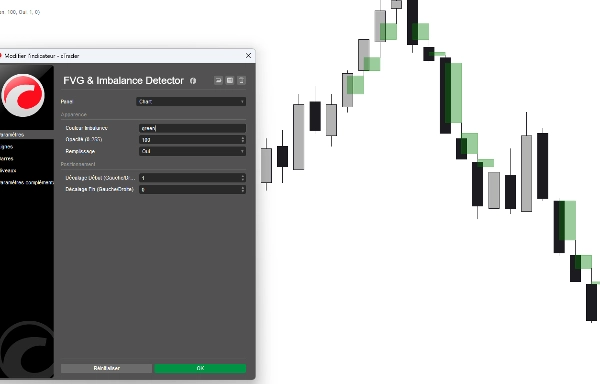
- スマート検出ロジック: 高度なアルゴリズムがトップ(ベアリッシュ)とボトム(ブルリッシュ)の非効率をピクセル単位の精度で識別します。
- 双方向オフセット: 独自の「開始」と「終了」オフセットパラメーターにより、ゾーンを前方または後方に投影し、過去のギャップが現在の価格動向とどのように一致するかを確認できます。
- プロフェッショナルなカラーユーザーインターフェース: クリーンなドロップダウンメニューから好みのスタイル(イエロー、アクア、レッドなど)を選択可能で、16進コードを入力する必要はありません!
- 不透明度コントロール: ゾーンが価格の視認性を妨げないように透明度を調整できます。
- 最適化されたパフォーマンス: 複数のチャートでもcTraderプラットフォームの動作を遅くしない軽量コード。
使い方:
- ギャップの特定: インジケーターは、最初のローソク足の高値と3番目のローソク足の安値の間に不均衡が発生した場所にボックスを描画します。
- 再テストを待つ: 価格がこれらのボックスに戻るのを観察します。
- 実行: FVGゾーン内の拒否パターンを探し、リスクが低くリターンが高いエントリーを行います。
概要
AIによる概要
The FVG & Imbalance Detector is an indicator for the cTrader platform designed to identify Fair Value Gaps (FVG) and price imbalances, key concepts in Smart Money Concepts (SMC) and Institutional Cycle Trading (ICT). These gaps represent zones of market inefficiency created by rapid price moves, often reflecting institutional activity. The indicator automatically detects and highlights these zones on the chart with clear rectangular overlays, eliminating the need for manual drawing.
Key features include detection of both bullish (bottom) and bearish (top) imbalances with high precision, customizable zone extensions via start and end offset parameters, and adjustable opacity and color settings for clear visualization. The tool is optimized for performance to avoid slowing down the platform, even when applied to multiple charts.
Traders can use the indicator to spot where large institutional players have entered the market, identify high-probability zones for entries or take-profits, and monitor price retests of these inefficiency zones for potential trade execution. The indicator supports analysis across various markets including Forex, Indices, Commodities, and Crypto.
インジケーターのプロフィール
カスタマーレビュー
4.0
レビュー: 2
5 | 0 % | |
4 | 100 % | |
3 | 0 % | |
2 | 0 % | |
1 | 0 % |
カスタマーレビュー
January 18, 2026
tested small first and that felt like the right move, and account protection still comes first.
January 14, 2026
ディスカッション
よくあるご質問
Forex
Indices
Commodities
Crypto
AI
cTrader Storeで入手可能な取引ボット、インジケーター、プラグインなどの商品は、第三者の開発者が提供するものであり、情報と技術の取得のみを目的としてご利用いただけます。cTrader Storeはブローカーではなく、投資助言や個人的な推奨を行うことも、将来のパフォーマンスを保証することもありません。
この作成者の他の商品


これも好きかも


![「[Hamster-Coder] Pivot Points MTF」ロゴ](https://cdn.ctrader.com/image/webp/4c143e5a-309c-40e3-a578-f04d1e133ffa_31159)


価格
登録日 27/10/2025
10
販売