
Consolidation Zones
インジケーター
1 購入済
バージョン 1.0、Oct 2025
Windows、Mac
4.0
レビュー: 1
説明
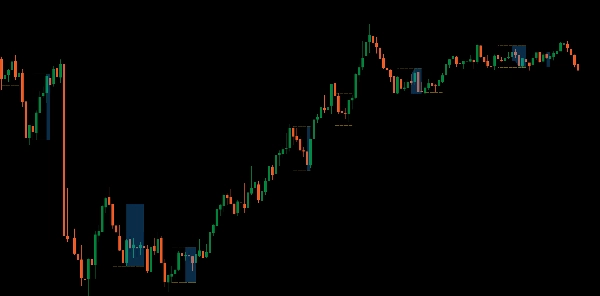
導入します コンソリデーションゾーン インジケーターは、ブレイクアウトのチャンスを簡単に特定し活用できるように設計されています。
この強力なツールは、価格が統合しているチャート上のゾーンを強調表示し、潜在的なブレイクアウトポイントを簡単に見つけられるようにします。これらの重要なエリアを視覚化することで、市場の動きをよりよく予測し、より情報に基づいた取引判断を下すことができます。
明確で実用的な洞察で戦略を強化したいトレーダーに最適です。取引ツールキットをアップグレードし、コンソリデーションゾーンインジケーターでブレイクアウトをマスターしましょう。
概要
AIによる概要
The Consolidation Zones indicator identifies and visualizes price consolidation areas on trading charts to help traders spot potential breakout points. By highlighting these zones, it assists in anticipating market movements and supports more informed decision-making. This tool is applicable across multiple markets, including Forex, cryptocurrencies (e.g., BTCUSD), commodities (e.g., gold, oil), indices (e.g., NAS100, SP500), and stocks. It is designed to enhance trading strategies focused on breakout opportunities by providing clear visual cues of consolidation phases.
インジケーターのプロフィール
カスタマーレビュー
4.0
レビュー: 1
5 | 0 % | |
4 | 100 % | |
3 | 0 % | |
2 | 0 % | |
1 | 0 % |
カスタマーレビュー
October 12, 2025
Two timeframes give more context, and the log becomes easier to read.
ディスカッション
よくあるご質問
BTCUSD
Forex
Breakout
Indices
EURUSD
Commodities
GBPUSD
NZDUSD
Prop
Crypto
Stocks
XAUUSD
NAS100
USDJPY
cTrader Storeで入手可能な取引ボット、インジケーター、プラグインなどの商品は、第三者の開発者が提供するものであり、情報と技術の取得のみを目的としてご利用いただけます。cTrader Storeはブローカーではなく、投資助言や個人的な推奨を行うことも、将来のパフォーマンスを保証することもありません。


価格
登録日 25/09/2025
25
販売
315
無料インストール