

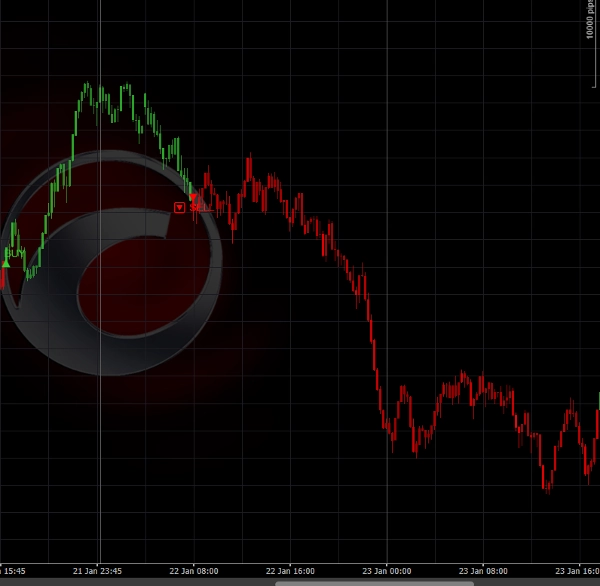
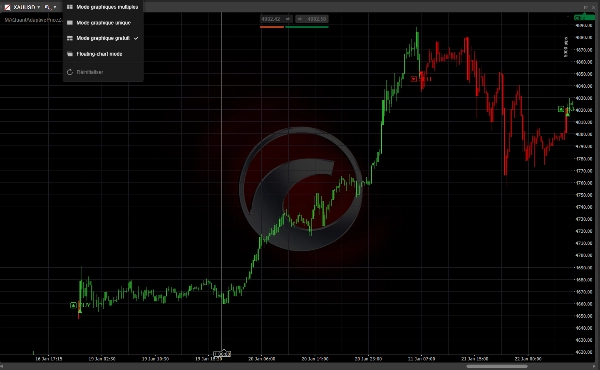
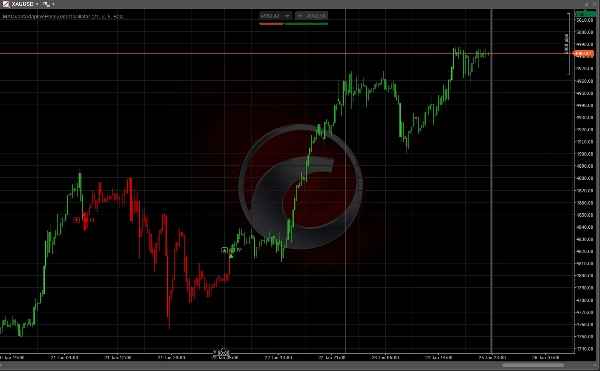
説明
🔍 概要
MA QuantのAdaptive Price Zone Oscillator(APZ)は、従来のオシレーターの現代的進化版で、市場のボラティリティに賢く適応するよう設計されています。静的な指標とは異なり、現在の取引条件に応じて自動的に閾値を調整し、転換点の特定において卓越した精度を提供します。
⚡ 主な機能
🎯 インテリジェントな適応分析
- 動的価格ゾーン : 過熱/過冷却ゾーンのリアルタイム計算
- 自動調整 : 手動介入なしで市場のボラティリティに適応
- マルチレベルフィルタリング : 複数期間での確認システム
- モメンタム計算 : シグナル検証のためのモメンタム統合
🛠️ 高度なシグナルシステム
- 3つのシグナルスタイル :
-
- 保守的 : 非常に強いシグナルのみ(強度 > 75%)
- 積極的 : より頻繁なシグナル(強度 > 25%)
- バランス型 : 最適な妥協(強度 > 50%)
- マルチバー確認 : 1~5期間での検証
- シグナル強度 : 各シグナルの品質の定量的測定
🎨 プロフェッショナルな視覚化
- 表示モード :
-
- バー : 強度グラデーションによるインテリジェントな着色
- アイコン : シグナルポイントの方向三角形
- コンビネーション : バー+アイコンの同時表示
- テキストシグナル : オプションの「🔼 BUY」/「🔽 SELL」ラベル
- カスタマイズ可能な色 : MA Quantのプロフェッショナルパレット
⚙️ 高度な技術パラメータ
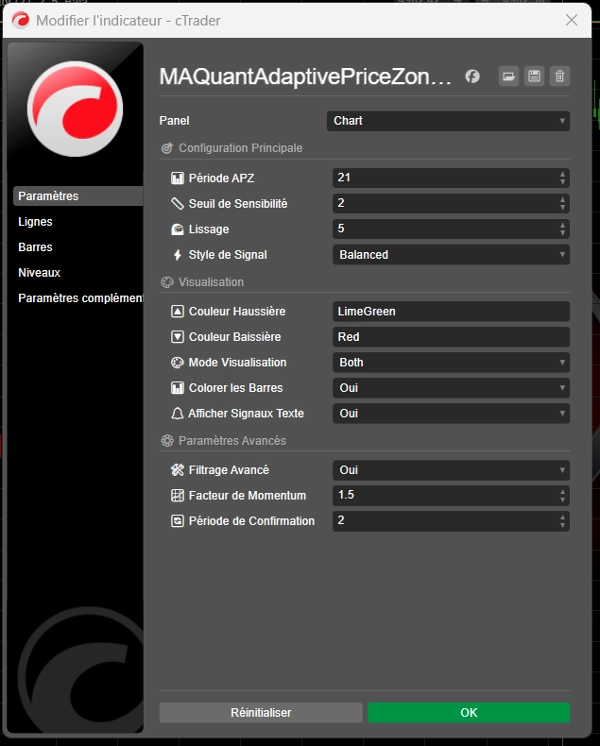
基本設定
- APZ期間 : 5-100(デフォルト: 21)- オシレーターの感度
- 感度閾値 : 0.5-5.0(デフォルト: 2.0)- バンドの距離
- 平滑化 : 2-20(デフォルト: 5)- 市場ノイズの削減
- シグナルスタイル : Conservative/Aggressive/Balanced
高度なパラメータ
- 高度なフィルタリング : マルチ期間確認の有効化
- モメンタム係数 : 1.0-3.0 - ダイナミクスに応じた増幅
- 確認期間 : 1-5バー - シグナルの堅牢性
🔬 技術アルゴリズム
1. 典型価格の計算(HLC3)
典型価格 = (高値 + 安値 + 終値) / 3
2. 適応型ボラティリティ測定
ボラティリティ = |典型価格[i] - 典型価格[i-1]|
EMAボラティリティ = EMA(ボラティリティ, APZ期間)
3. インテリジェントな適応バンド
平滑価格 = EMA(典型価格, 平滑化)
調整閾値 = 閾値 × モメンタム係数 × ボラティリティ比率
上バンド = 平滑価格 + (調整閾値 × EMAボラティリティ)
下バンド = 平滑価格 - (調整閾値 × EMAボラティリティ)
4. トレンド検出
価格 > 前の上バンド → トレンド = 上昇 (+1)
価格 < 前の下バンド → トレンド = 下降 (-1)
それ以外 → トレンド維持
5. シグナル強度
価格距離 = |価格 - バンド中心|
バンド幅 = 上バンド - 下バンド
ボラティリティ比率 = 現在のボラティリティ / EMAボラティリティ
強度 = (価格距離 / バンド幅) × ボラティリティ比率 × 100
📈 実用的な応用
スキャルピング用(M1-M5)
- APZ期間:10-15
- スタイル:積極的
- 確認:1-2バー
- 迅速かつ頻繁なシグナルに注目
日中取引用(M15-H1)
- APZ期間:21(デフォルト)
- スタイル:バランス型
- 確認:2-3バー
- 品質と頻度のバランス
スイングトレード用(H4-D1)
- APZ期間:30-50
- スタイル:保守的
- 確認:3-5バー
- 高品質シグナルに注力
🎯 トレーディングシグナル
🔼 買いシグナル
- 条件 : 価格が上バンドを上抜ける
- 確認 : X期間の維持(設定可能)
- 検証 : シグナル強度 > 選択閾値
- 表示 : 緑の三角形 + 「🔼 BUY」(オプション)
🔽 売りシグナル
- 条件 : 価格が下バンドを下抜ける
- 確認 : X期間の維持(設定可能)
- 検証 : シグナル強度 > 選択閾値
- 表示 : 赤の三角形 + 「🔽 SELL」(オプション)
🏆 競争上の利点
✅ 自動適応 : 市場条件に自動調整
✅ ノイズフィルタリング : 偽シグナルを効果的に削減
✅ 品質測定 : 各シグナルの強度を定量化
✅ モダンなインターフェース : 絵文字を使ったプロフェッショナルなデザイン
✅ 柔軟な設定 : 3つのプリセットスタイル+カスタマイズ可能
✅ 最適化されたパフォーマンス : 高性能C#コード
✅ マルチタイムフレーム対応 : M1から日足まで効果的
✅ 統合統計 : リアルタイムのパフォーマンス追跡
💡 MA Quantの革新
🧠 適応知能
- 過去と現在のボラティリティに基づく自動調整
- 強いトレンドでシグナルを増幅するモメンタム係数
- ホイップソーを減らすマルチ期間確認システム
🎨 高度な視覚化
- シグナル強度に応じた色のグラデーション
- 即時の明確さのための絵文字付きユーザーインターフェース
- シグナルカウンター付きリアルタイム統計
⚙️ インテリジェントな設定
- 簡単なナビゲーションのための論理的なパラメータグループ
- プリセットスタイル(保守的/積極的/バランス型)
- 経験豊富なトレーダー向けの高度なオプション
📚 クイックスタートガイド
- インストール : cTraderにインジケーターをロード
- 基本設定 :
-
- APZ期間:21
- スタイル:バランス型
- 表示:両方(バー+アイコン)
- 初期分析 : H1チャートでシグナルを観察
- 最適化 : トレードスタイルに合わせて調整
- 確認 : 他の指標で検証
- 実行 : 確認済みシグナルでトレード
- 追跡 : リアルタイム統計をモニター
🔧 推奨設定
保守的設定
APZ期間: 30
閾値: 2.5
スタイル: Conservative
確認: 3-5バー
積極的設定
APZ期間: 15
閾値: 1.5
スタイル: Aggressive
確認: 1-2バー
バランス設定
APZ期間: 21
閾値: 2.0
スタイル: Balanced
確認: 2-3バー
📊 パフォーマンス指標
インジケーターは自動的に以下を追跡します:
- 生成された上昇シグナルの数
- 生成された下降シグナルの数
- 最後のシグナルのインデックスと価格
- シグナルの平均強度
- クローズ時に表示される統計
🔬 科学的基盤
APZ MA Quantは以下の確立された金融概念に基づいています:
- 適応型ボラティリティ : 動的ATRに基づく調整
- 平均回帰 : 移動バンドによる平均への回帰
- モメンタム分析 : 方向性分析による確認
- シグナルフィルタリング : 時間的集約によるノイズ削減
🏷️ ライセンス : Creative Commons Attribution-NonCommercial-ShareAlike 4.0
👨💻 開発者 : MA Quant(QuantAlgoオリジナルから強化)
🔄 バージョン : 2.0 Professional
📅 日付 : 2026年1月
"適応知能がプロのトレーディングに出会う - 市場分析の未来を体験してください"
概要
Key features include:
- Dynamic price zones adjusting automatically to current market conditions without manual input.
- Multi-level filtering with confirmation across 1 to 5 bars to reduce false signals.
- Three signal styles (Conservative, Balanced, Aggressive) based on signal strength thresholds.
- Visual display options combining color-coded bars, directional triangles, and optional text labels ("🔼 BUY" / "🔽 SELL").
- Advanced parameters for sensitivity, smoothing, momentum factor, and confirmation period customization.
- Real-time performance metrics tracking signal counts, strength, and last signal details.
The indicator supports multiple timeframes from 1-minute scalping to daily swing trading, with recommended presets for each style. It is based on established financial concepts including adaptive volatility (ATR-based), mean reversion, momentum confirmation, and temporal signal filtering. The implementation uses high-performance C# code and offers a professional user interface with customizable color palettes and emoji-enhanced clarity.
Markets supported include Forex, indices, commodities, cryptocurrencies, and stocks, with tags indicating symbols like BTCUSD, EURUSD, GBPUSD, XAUUSD, NAS100, and USDJPY.
カスタマーレビュー
5 | 0 % | |
4 | 100 % | |
3 | 0 % | |
2 | 0 % | |
1 | 0 % |







![「[Stellar Strategies] VBO」ロゴ](https://cdn.ctrader.com/image/webp/f034c012-94d4-445a-a01b-febd1cdedaef_36944)










