
TSI True Strength Index
インジケーター
バージョン 1.0、Nov 2025
Windows、Mac
4.0
レビュー: 1
説明
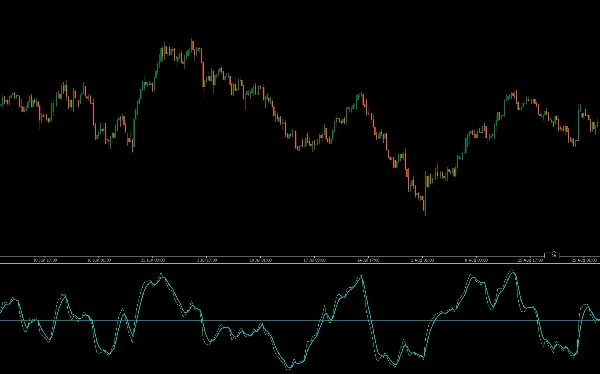
True Strength Index(TSI)インジケーターの紹介は、市場の勢いとトレンドの強さに関する明確な洞察を提供することで、あなたの取引戦略を強化するために設計された強力なツールです。
TSIインジケーターは価格変動の基礎的な強さを測定し、市場のノイズを平滑化してトレンドの方向性をより正確に把握できるようにします。買われ過ぎや売られ過ぎの状態を強調することで、TSIは潜在的な反転ポイントの特定やトレンドの継続の確認に役立ちます。
TSIは金融商品の基礎的なモメンタムの移動平均を使用します。モメンタムは価格変動の先行指標と考えられ、移動平均は一般的に価格に遅れて反応します。TSIはこれらの特性を組み合わせ、市場の転換点とより同期した価格と方向の指標を作り出します。
分析を洗練し意思決定を改善したいトレーダーに最適なTSIインジケーターは、市場の動態を測る信頼性が高く直感的な方法を提供します。True Strength Indexで取引ツールキットをアップグレードし、優れた取引パフォーマンスを実現しましょう。
- トレンドの識別:TSIが正の場合は強気トレンドを示し、負の場合は弱気トレンドを示します。
- モメンタムの強さ:トレンドの動きの強さを測定し、値が高いほどモメンタムが強いことを示します。
- 潜在的な反転シグナル:
-
- クロスオーバー:ゼロライン付近でのシグナルラインのクロスオーバーは、潜在的なエントリーおよびエグジットポイントを示すことがあります。
- ダイバージェンス:価格が新しい高値または安値をつけてもTSIがそれに追随しない場合、潜在的なトレンド反転を示すことがあります。
- 買われ過ぎ/売られ過ぎの状態:資産が買われ過ぎまたは売られ過ぎの可能性がある時を特定するのに役立ちますが、具体的な買われ過ぎおよび売られ過ぎのレベルは資産のボラティリティによって異なる場合があります。
概要
インジケーターのプロフィール
カスタマーレビュー
4.0
レビュー: 1
5 | 0 % | |
4 | 100 % | |
3 | 0 % | |
2 | 0 % | |
1 | 0 % |
カスタマーレビュー
November 22, 2025
The setup improves when the opening read should not drive the whole decision, and 3 percent DD is the line to watch.
ディスカッション
よくあるご質問
BTCUSD
Forex
Signal
Indices
EURUSD
Commodities
GBPUSD
NZDUSD
Prop
Crypto
Stocks
XAUUSD
NAS100
USDJPY
cTrader Storeで入手可能な取引ボット、インジケーター、プラグインなどの商品は、第三者の開発者が提供するものであり、情報と技術の取得のみを目的としてご利用いただけます。cTrader Storeはブローカーではなく、投資助言や個人的な推奨を行うことも、将来のパフォーマンスを保証することもありません。


価格
登録日 25/09/2025
25
販売
315
無料インストール