
Bollinger Bands Cloud
インジケーター
バージョン 1.0、Oct 2025
Windows、Mac
4.5
レビュー: 2
説明
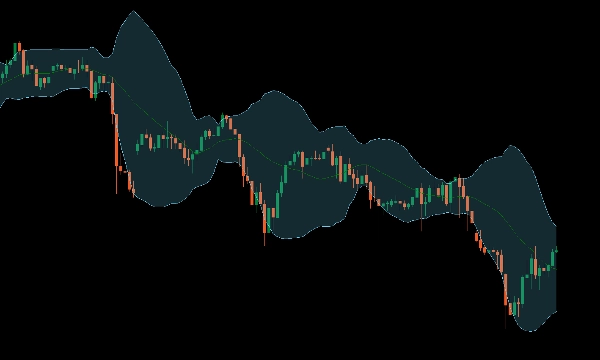
より明確な視覚化でトレーディング体験を向上させるために設計された、強化されたボリンジャーバンド指標をご紹介します。
この視覚的な強化により、市場のボラティリティを解釈しやすくなり、潜在的なブレイクアウトや反転ポイントを特定しやすくなります。より明確な洞察と改善された意思決定を求めるトレーダーに最適です。
より鋭い分析とより良い結果のために、今日トレーディングツールキットをアップグレードしましょう。
概要
インジケーターのプロフィール
カスタマーレビュー
4.5
レビュー: 2
5 | 50 % | |
4 | 50 % | |
3 | 0 % | |
2 | 0 % | |
1 | 0 % |
カスタマーレビュー
October 27, 2025
Win rate means less without average R. It helps separate patience from hesitation.
October 20, 2025
The setup gets reviewed from another angle, but overconfidence is the real danger.
ディスカッション
よくあるご質問
BTCUSD
Forex
Signal
Breakout
Indices
EURUSD
Commodities
GBPUSD
NZDUSD
Bollinger
Prop
Scalping
Crypto
Stocks
XAUUSD
NAS100
USDJPY
cTrader Storeで入手可能な取引ボット、インジケーター、プラグインなどの商品は、第三者の開発者が提供するものであり、情報と技術の取得のみを目的としてご利用いただけます。cTrader Storeはブローカーではなく、投資助言や個人的な推奨を行うことも、将来のパフォーマンスを保証することもありません。


![「High-Low Divergence [Iridio Capital]」ロゴ](https://cdn.ctrader.com/image/webp/443c4661-7abb-40f1-842f-4b6ec560649b_40914)


価格
登録日 25/09/2025
25
販売
331
無料インストール