
Descrição
Média Móvel Hull Colorida – Direção da Tendência num Relance
Visão Geral
A Média Móvel Hull Colorida é um indicador simplificado de seguimento de tendência que aplica a capacidade de resposta da Média Móvel Hull com sinais direcionais codificados por cores. Ao exibir tendências de alta em verde e tendências de baixa em vermelho, fornece confirmação visual instantânea da direção do momentum sem exigir análises complexas.
O Que Faz
Fundação da Média Móvel Hull: O indicador usa a Média Móvel Hull (HMA), uma média móvel de reação rápida projetada para reduzir o atraso mantendo a suavidade. Diferente das médias móveis tradicionais, a HMA prioriza a ação recente do preço, tornando-a particularmente útil para capturar mudanças de tendência precocemente.
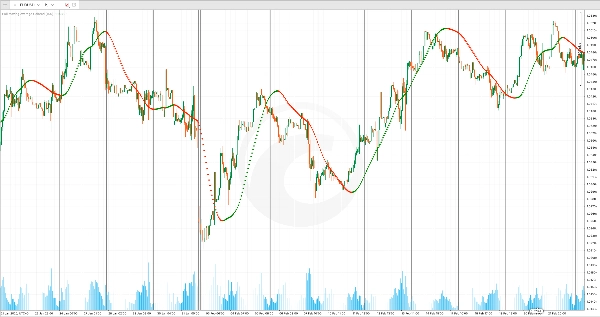
Visualização da Tendência Codificada por Cores: Em vez de uma linha única, o indicador plota pontos direcionais:
- Pontos Verdes: Aparecem quando a HMA está subindo, indicando momentum ascendente
- Pontos Vermelhos: Aparecem quando a HMA está caindo, indicando momentum descendente
Este sistema binário de cores torna a direção da tendência inconfundível num relance—não há necessidade de interpretar inclinação ou comparar com barras anteriores.
Principais Características
Exibição Sobreposta: O indicador é plotado diretamente no seu gráfico de preços, permitindo que você veja a direção da tendência em relação aos níveis reais de preço. Isso facilita identificar quando o preço rompe acima ou abaixo da média móvel, sinalizando potenciais pontos de entrada e saída.
Redução Responsiva do Atraso: A Média Móvel Hull reage mais rápido do que médias móveis exponenciais ou simples padrão, tornando-a particularmente eficaz para traders de swing e intraday que precisam de sinais oportunos sem oscilações excessivas.
Personalização Simples: Ajuste o parâmetro Período para controlar a sensibilidade. Períodos mais curtos (ex.: 20-32) tornam o indicador mais responsivo a movimentos recentes, mas propenso a sinais falsos em mercados voláteis. Períodos mais longos (ex.: 64-128) proporcionam tendências mais suaves com menos falsos rompimentos, mas podem perder reversões rápidas.
Uso Prático
Use a Média Móvel Hull Colorida como um filtro rápido para a direção do trade. Faça trades longos apenas quando pontos verdes aparecerem e o preço estiver acima da média; faça trades curtos apenas quando pontos vermelhos aparecerem e o preço estiver abaixo da média. Por outro lado, trate mudanças de cor como potenciais sinais de saída—quando o verde muda para vermelho, é hora de reavaliar suas posições longas.
O indicador funciona bem em mercados com tendência e é especialmente útil em timeframes maiores (4 horas e diário), onde pode ajudar a alinhar-se com o viés direcional mais amplo antes de operar setups em timeframes menores.
Resumo
This indicator overlays directly on price charts and uses a binary color system to indicate trend direction: green points appear when the HMA is rising, signaling upward momentum, and red points appear when the HMA is falling, signaling downward momentum. This visual approach allows traders to quickly identify trend direction without interpreting slopes or comparing previous bars.
Users can adjust the period parameter to control sensitivity—shorter periods increase responsiveness but may generate more false signals, while longer periods smooth trends but may delay signals. The indicator is suitable for various markets including Forex, indices, stocks, and cryptocurrencies such as BTCUSD and XAUUSD. It is particularly useful on higher timeframes (4-hour and daily) for aligning with broader market trends and can assist in identifying potential entry and exit points based on trend changes.
Avaliações de clientes
5 | 0 % | |
4 | 100 % | |
3 | 0 % | |
2 | 0 % | |
1 | 0 % |


