
Deskripsi
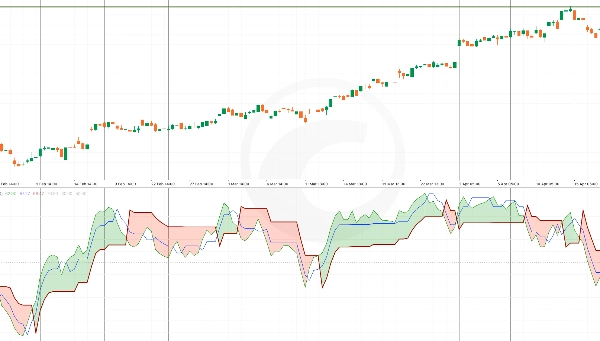
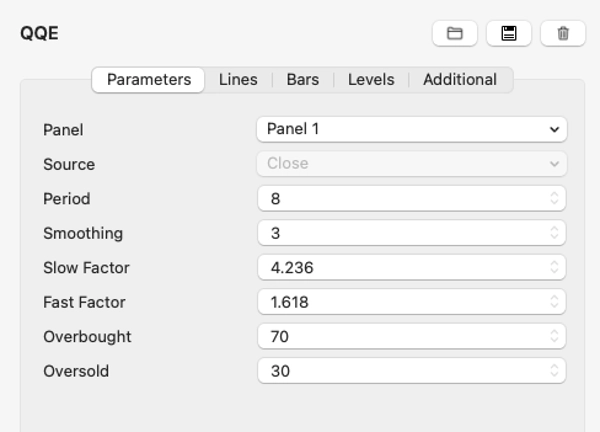
Indikator Quantitative Qualitative Estimation (QQE) adalah alat analisis teknikal yang meningkatkan Relative Strength Index (RSI) dengan menggabungkan rata-rata bergerak yang dihaluskan. Ini membantu para trader menilai kekuatan tren, potensi pembalikan, dan kondisi jenuh beli/jenuh jual dengan akurasi yang lebih tinggi.
QQE memiliki dua komponen utama: level trailing stop cepat dan lambat, yang berfungsi sebagai dukungan dan resistensi dinamis. Ini menjadikannya alat yang serbaguna untuk strategi mengikuti tren dan mean-reversion. Persilangan antara garis QQE dan garis sinyalnya sering menunjukkan potensi peluang beli atau jual.
Ringkasan
Ringkasan AI
The Quantitative Qualitative Estimation (QQE) indicator is a technical analysis tool that enhances the Relative Strength Index (RSI) by integrating smoothed moving averages. It provides improved assessment of trend strength, potential reversals, and overbought or oversold market conditions. The indicator includes two main components: fast and slow trailing stop levels, which serve as dynamic support and resistance points. This design supports both trend-following and mean-reversion trading strategies. Additionally, crossovers between the QQE line and its signal line are used to identify potential buy or sell signals. The QQE indicator is applicable across various markets, including indices, and is categorized under momentum indicators.
Profil indikator
Ulasan pelanggan
0.0
Ulasan: 0
Ulasan pelanggan
Belum ada ulasan untuk produk ini. Sudah mencobanya? Jadilah pemberi ulasan pertama!
Diskusi
Pertanyaan umum
Signal
Indices
RSI
Produk-produk yang tersedia melalui cTrader Store, termasuk bot trading, indikator, dan plugin, disediakan oleh pengembang pihak ketiga serta hanya ditujukan untuk akses teknis dan informasi. cTrader Store bukan broker dan tidak menyediakan saran investasi, rekomendasi pribadi, atau jaminan apa pun tentang kinerja di masa mendatang.


![Logo "[Hamster-Coder] Bollinger Bands"](https://cdn.ctrader.com/image/webp/21d8e5d6-fb11-4bac-b9ee-cd05c2b76804_30327)


Harga
12
Penjualan
421
Instal gratis