
FAMA-MAMA
Indicador
Versión 1.0, May 2025
Windows, Mac
5.0
Valoraciones: 1
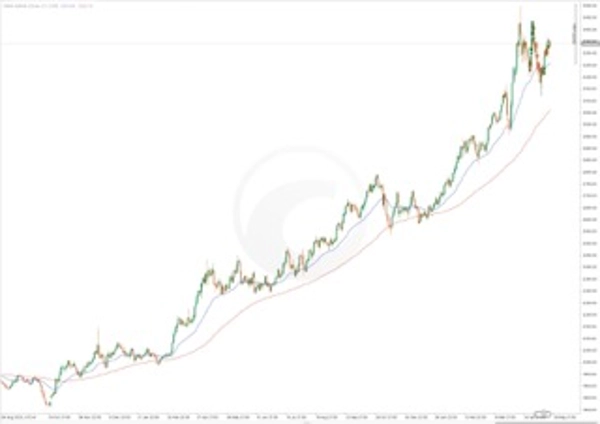
El Indicador FAMA-MAMA es una herramienta de tendencia dinámica y adaptativa diseñada para traders que necesitan una visión más clara de la dirección del mercado. Basado en la Media Móvil Adaptativa MESA (MAMA) y su línea complementaria (FAMA), este indicador se ajusta a las condiciones cambiantes del mercado para resaltar cambios de tendencia y reducir el ruido en el gráfico.
Aspectos destacados:
- Líneas de Tendencia Adaptativas: MAMA se ajusta a los ciclos del mercado, haciéndolo más sensible en condiciones de tendencia y más suave en condiciones de rango.
- Señales Claras de Cruce: Las señales de compra y venta se generan cuando MAMA cruza FAMA.
- Configuraciones Personalizables: Cambia colores, estilos de línea y sensibilidad para ajustarlos a tu estrategia y preferencias visuales.
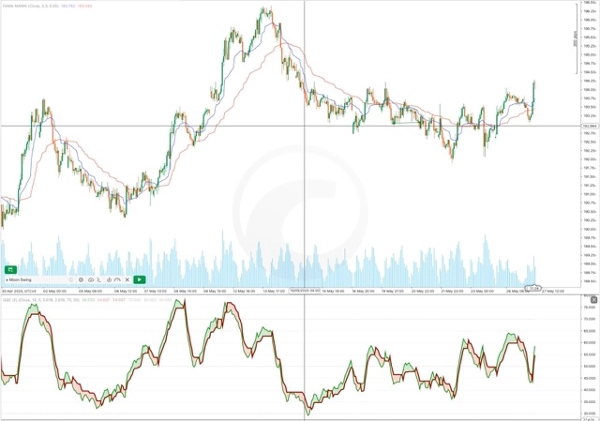
- Integración Visual: Se muestra directamente en tu gráfico para facilitar el reconocimiento de señales.
Lógica de Señales:
- Cuando MAMA cruza por encima de FAMA → Momentum alcista
- Cuando MAMA cruza por debajo de FAMA → Momentum bajista
Adecuado para múltiples estilos de trading, incluyendo intradía y swing trading, este indicador ayuda a los traders a seguir las tendencias del mercado con claridad y confianza.
Perfil del indicador
5.0
Valoraciones: 1
5 | 100 % | |
4 | 0 % | |
3 | 0 % | |
2 | 0 % | |
1 | 0 % |
Signal
Los productos disponibles a través de cTrader Store, incluidos bots, indicadores y plugins para operar, son proporcionados por desarrolladores de terceros y están disponibles únicamente con fines informativos y de acceso técnico. cTrader Store no es un bróker, por lo que no proporciona asesoramiento de inversión, recomendaciones personales ni ninguna garantía de rentabilidad futura.


12
Ventas
406
Instalaciones gratis