
Descripción
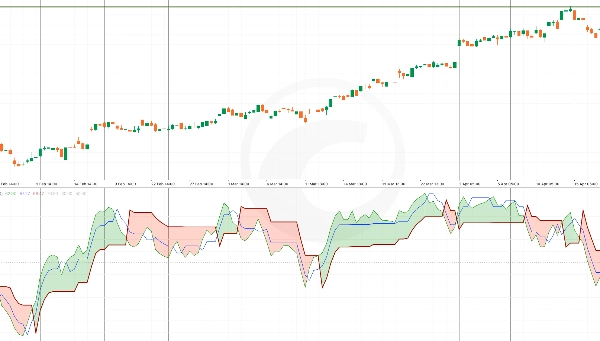
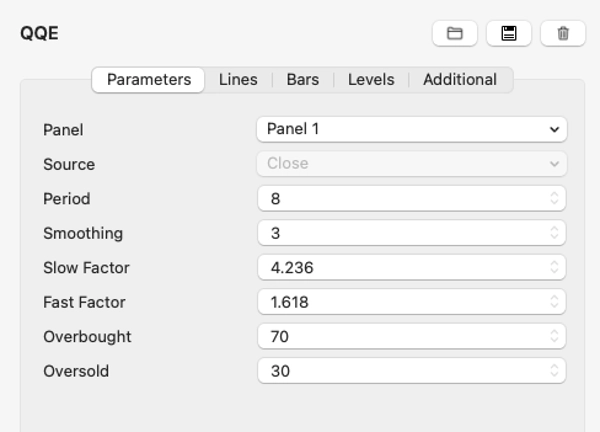
El Indicador de Estimación Cualitativa Cuantitativa (QQE) es una herramienta de análisis técnico que mejora el Índice de Fuerza Relativa (RSI) incorporando medias móviles suavizadas. Ayuda a los traders a evaluar la fuerza de la tendencia, posibles reversiones y condiciones de sobrecompra/sobreventa con mayor precisión.
QQE cuenta con dos componentes clave: los niveles de stop trailing rápido y lento, que actúan como soporte y resistencia dinámicos. Esto lo convierte en una herramienta versátil tanto para estrategias de seguimiento de tendencia y de reversión a la media. Un cruce entre la línea QQE y su línea de señal a menudo indica posibles oportunidades de compra o venta.
Resumen
Resumen de IA
The Quantitative Qualitative Estimation (QQE) indicator is a technical analysis tool that enhances the Relative Strength Index (RSI) by integrating smoothed moving averages. It provides improved assessment of trend strength, potential reversals, and overbought or oversold market conditions. The indicator includes two main components: fast and slow trailing stop levels, which serve as dynamic support and resistance points. This design supports both trend-following and mean-reversion trading strategies. Additionally, crossovers between the QQE line and its signal line are used to identify potential buy or sell signals. The QQE indicator is applicable across various markets, including indices, and is categorized under momentum indicators.
Perfil del indicador
Valoraciones de clientes
0.0
Valoraciones: 0
Valoraciones de clientes
Este producto todavía no se ha valorado. ¿Ya lo ha probado? Sea el primero en informar a otros.
Conversación
Preguntas frecuentes
Signal
Indices
RSI
Los productos disponibles a través de cTrader Store, incluidos bots, indicadores y plugins para operar, son proporcionados por desarrolladores de terceros y están disponibles únicamente con fines informativos y de acceso técnico. cTrader Store no es un bróker, por lo que no proporciona asesoramiento de inversión, recomendaciones personales ni ninguna garantía de rentabilidad futura.


![Logotipo de "Smart Money Concepts (SMC) [Iridio Capital]"](https://cdn.ctrader.com/image/webp/28b69fd1-ef54-4bed-9487-07e78e883be4_40934)


Precio
12
Ventas
415
Instalaciones gratis