
Rsi + Volume
Indicador
707 descargas
Versión 1.0, Mar 2025
Windows, Mac
5.0
Valoraciones: 3
Descripción
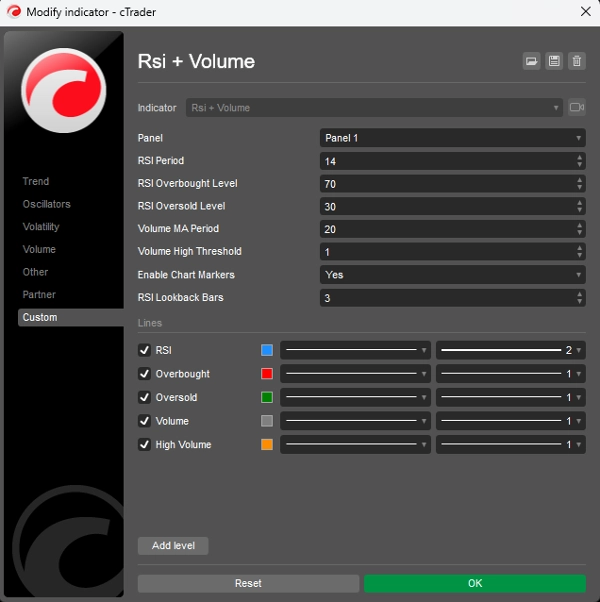
Este indicador combina el RSI (Índice de Fuerza Relativa) con el análisis de volumen para generar señales de trading más confiables. Funciona bajo el principio de que los movimientos significativos del precio deben ir acompañados de un alto volumen para confirmar la fuerza del movimiento.
Componentes clave:
- Análisis RSI:
-
- Mide la velocidad y el cambio de los movimientos de precio en una escala de 0-100
- Identifica condiciones de sobrecompra (por encima de 70) y sobreventa (por debajo de 30)
- Ayuda a detectar posibles puntos de reversión en el mercado
- Análisis de volumen:
-
- Compara el volumen actual con un promedio móvil del volumen reciente
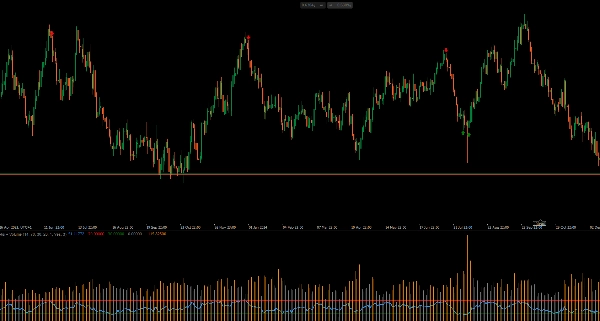
- Destaca períodos de alto volumen (barras del histograma naranja)
- Confirma la fuerza detrás de los movimientos de precio
- Generación de señales:
-
- Señal de compra: Cuando el RSI cruza por encima del nivel de sobreventa (30) con alto volumen
- Señal de venta: Cuando el RSI cruza por debajo del nivel de sobrecompra (70) con alto volumen
- Las señales visuales aparecen directamente en el gráfico (flechas verdes hacia arriba para comprar, flechas rojas hacia abajo para vender)
Cómo usarlo:
- Busque señales de compra cuando el precio esté en una tendencia bajista y el RSI muestre condiciones de sobreventa
- Busque señales de venta cuando el precio esté en una tendencia alcista y el RSI muestre condiciones de sobrecompra
- Un mayor volumen confirma la fuerza de la señal
- Ajuste los parámetros (periodo del RSI, umbral de volumen) para que coincidan con su marco temporal de trading
Este indicador ayuda a filtrar señales falsas al requerir tanto la confirmación del RSI como un volumen superior al promedio, haciéndolo más confiable que usar solo el RSI.
Resumen
Resumen de IA
The "Rsi + Volume" indicator integrates the Relative Strength Index (RSI) with volume analysis to enhance the reliability of trading signals. It operates on the principle that significant price movements should be confirmed by high trading volume.
Key components include:
1. RSI Analysis:
- Measures the speed and change of price movements on a 0-100 scale.
- Identifies overbought conditions (above 70) and oversold conditions (below 30).
- Helps detect potential market reversal points.
2. Volume Analysis:
- Compares current volume against a moving average of recent volume.
- Highlights periods of high volume using orange histogram bars.
- Confirms the strength behind price movements.
Signal generation occurs when RSI crosses key thresholds with accompanying high volume:
- Buy signals trigger when RSI rises above the oversold level (30) with high volume.
- Sell signals trigger when RSI falls below the overbought level (70) with high volume.
Visual signals appear directly on the chart as green up arrows for buys and red down arrows for sells.
Users can adjust parameters such as RSI period and volume threshold to fit their trading timeframe. This indicator aims to filter out false signals by requiring both RSI confirmation and above-average volume, providing more dependable trade signals than RSI alone.
Perfil del indicador
Valoraciones de clientes
5.0
Valoraciones: 3
5 | 100 % | |
4 | 0 % | |
3 | 0 % | |
2 | 0 % | |
1 | 0 % |
Valoraciones de clientes
October 12, 2025
Hello, the RSI +volume indicator is perfect, but it needed to have something: when the little arrow appears on the chart, it could show a notification or an alarm. Would you be able to add that alarm or notification in cTrader?
August 12, 2025
Pros: Combines RSI and volume for stronger trading signals. Works well when RSI threshold intersects with high volume spikes. Lightweight and clear visuals. Cons: No alerts or tooltips. Lacks template saving. May generate noise on low-volume timeframes without additional filters.
Conversación
Preguntas frecuentes
Signal
Indices
RSI
Los productos disponibles a través de cTrader Store, incluidos bots, indicadores y plugins para operar, son proporcionados por desarrolladores de terceros y están disponibles únicamente con fines informativos y de acceso técnico. cTrader Store no es un bróker, por lo que no proporciona asesoramiento de inversión, recomendaciones personales ni ninguna garantía de rentabilidad futura.


Precio
Desde 21/02/2025
466.3M
Volumen operado
180.83K
Pips ganados
22
Ventas
6.92K
Instalaciones gratis