

DailyTargets
Indicador
223 descargas
Versión 1.0, May 2026
Windows, Mac
5.0
Valoraciones: 2
Desde 21/02/2025
466.3M
Volumen operado
180.83K
Pips ganados
26
Ventas
7.43K
Instalaciones gratis
Descripción
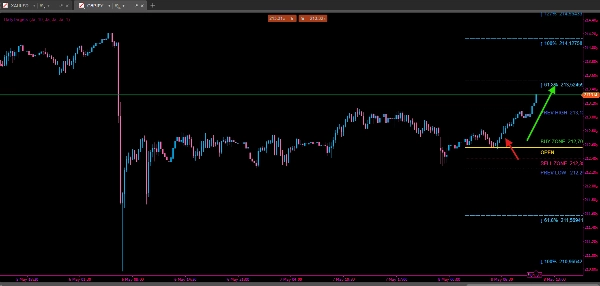
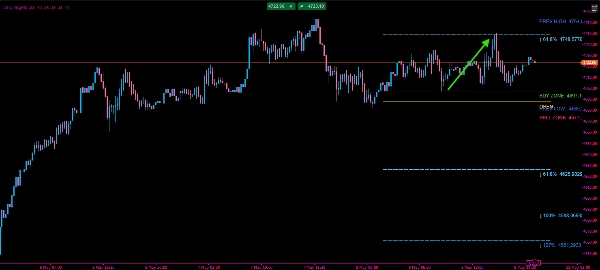
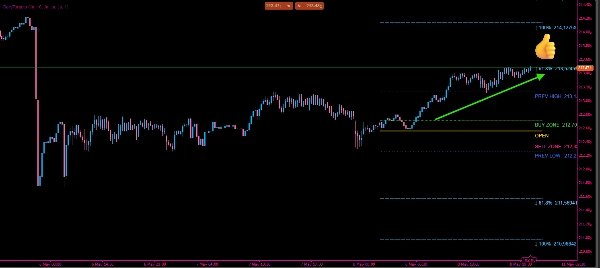
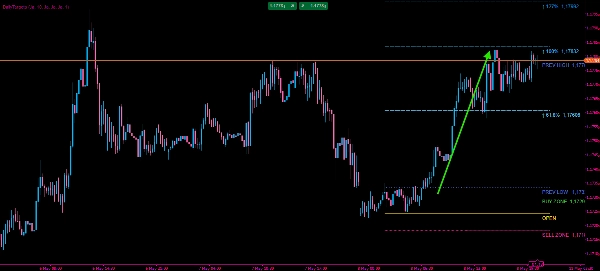
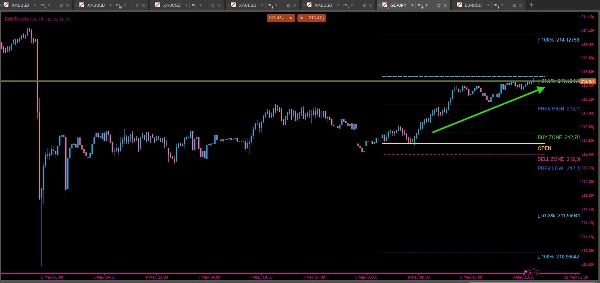
Mejore su precisión diaria en el trading con DailyTargets, un indicador superpuesto integral diseñado para resaltar niveles institucionales clave y objetivos basados en la volatilidad. Al utilizar un rango diario promedio (ADR) de múltiples períodos, esta herramienta proporciona una hoja de ruta clara para cada sesión de trading.
Características clave:
- Zonas dinámicas de compra/venta: Calcula automáticamente las zonas de entrada basándose en un porcentaje de la volatilidad diaria desde la apertura del mercado.
- Objetivos de volatilidad: Traza niveles claros para tomar ganancias basados en los ratios de Fibonacci y ADR estándar (61.8%, 100%, 127%, 161% y 200%).
- Contexto del mercado: Muestra los niveles máximos y mínimos del día anterior para identificar posibles puntos de ruptura o reversión.
- Alertas en tiempo real: Manténgase informado con notificaciones instantáneas cuando el precio cruce la apertura diaria, señalando un posible cambio en la tendencia intradía.
- Totalmente personalizable: Ajuste el ancho de las líneas, estilos y visibilidad de componentes individuales para que coincidan con su plantilla personal de gráficos.
Lógica técnica: El indicador calcula un promedio ponderado del ADR (1, 5, 10 y 20 períodos) para proporcionar una medición de volatilidad suavizada pero sensible. Esto asegura que sus objetivos se adapten a las condiciones actuales del mercado, ya sea que el mercado esté en tendencia o consolidándose.
Resumen
AI summary
DailyTargets is a trading indicator that overlays dynamic, volatility-based levels and targets on price charts. It calculates a weighted average of the Average Daily Range (ADR) across multiple periods (1, 5, 10, and 20) to provide smoothed, adaptive volatility measurements. Key features include automatically generated Buy and Sell zones based on a percentage of daily volatility from the market open, and plotted profit-taking targets using Fibonacci and standard ADR ratios (61.8%, 100%, 127%, 161%, and 200%). The indicator also displays the previous day's High and Low levels to help identify potential breakout or reversal points. Real-time alerts notify users when the price crosses the daily open, signaling possible intraday trend shifts. Users can customize line widths, styles, and visibility of individual components to fit their chart preferences. DailyTargets supports visualization of key institutional levels and volatility targets to assist traders in planning entries, exits, and managing intraday market context.
Perfil del indicador
Categoría del indicador
Soporte y resistencia
Tipo de resultado
Visualización
Requisitos de datos
Únicamente barras
Señales admitidas
Ruptura
Ruptura de nivel
Toque de nivel
Rango en la apertura de la sesión
Valoraciones de clientes
5.0
Valoraciones: 2
5 | 100 % | |
4 | 0 % | |
3 | 0 % | |
2 | 0 % | |
1 | 0 % |
Valoraciones de clientes
September 10, 2026
DailyTargets is a practical ADR-based overlay that clearly displays the daily open, Buy/Sell zones, previous-day High/Low and 61.8–200% volatility targets. Testing on EURUSD and XAUUSD showed clean intraday rendering and good M1/H1 consistency. The main limitations were reduced readability on very high timeframes and an unusual D1 display state that deserves clarification. Alerts and the exact weighted ADR formula were not independently verified, but the core visual functionality performed well.
May 27, 2026
The setup is straightforward and it integrates smoothly into my existing chart layout. It works well across different timeframes and asset classes, which makes it very versatile.
Conversación
Preguntas frecuentes
Fibonacci
Key Levels
Los productos disponibles a través de cTrader Store, incluidos bots, indicadores y plugins para operar, son proporcionados por desarrolladores de terceros y están disponibles únicamente con fines informativos y de acceso técnico. cTrader Store no es un bróker, por lo que no proporciona asesoramiento de inversión, recomendaciones personales ni ninguna garantía de rentabilidad futura.





























Precio
Desde 21/02/2025
466.3M
Volumen operado
180.83K
Pips ganados
26
Ventas
7.43K
Instalaciones gratis