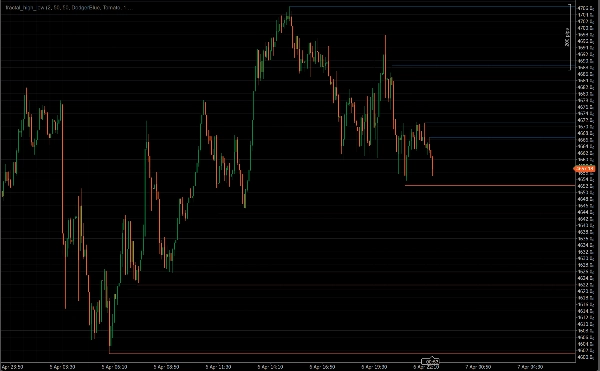
Trading product for fractal_high_low Indikator BTCUSD Prop, image 1
Indikator
144 downloads
Version 1.1, Apr 2026
Windows, Mac
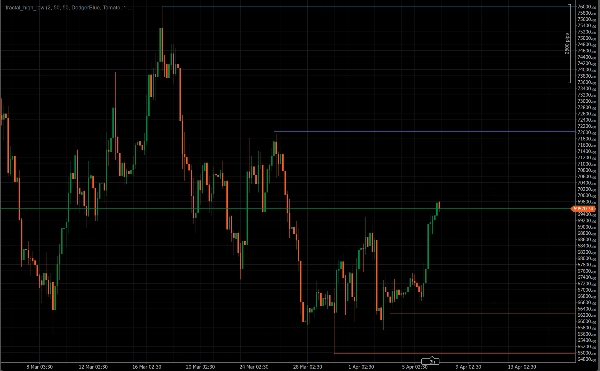
Trading product for fractal_high_low Indikator BTCUSD Prop, image 2
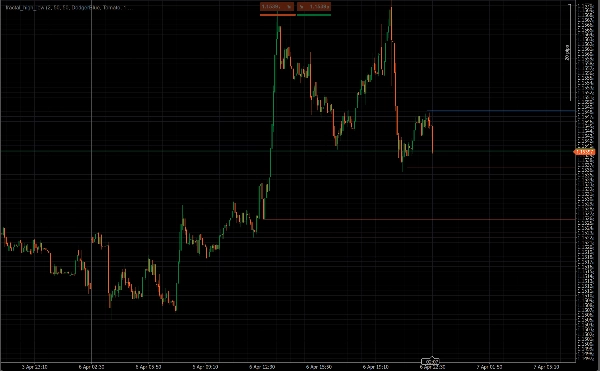
Trading product for fractal_high_low Indikator BTCUSD Prop, image 3
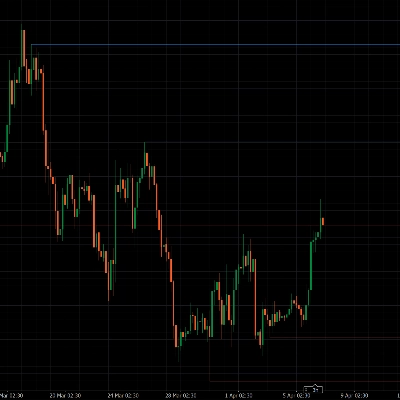
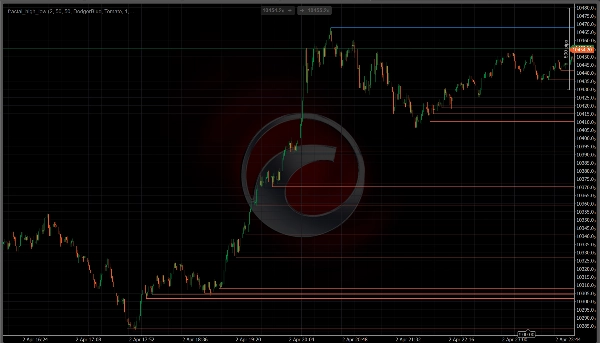
Trading product for fractal_high_low Indikator BTCUSD Prop, image 4
Trading product for fractal_high_low Indikator BTCUSD Prop, image 5
Seit 20/09/2025
125.27M
Gehandeltes Volumen
773.83K
Pip-Gewinn
144
Kostenlose Installationen

Beschreibung

Wenn Sie Price Action handeln, wissen Sie bereits, dass die wichtigsten

Level in jedem Chart Fraktalhochs und -tiefs sind β€”

die Wendepunkte, an denen der Preis abgelehnt, umgekehrt oder die

Struktur durchbrochen hat. Frac High Low Lines findet diese Punkte fΓΌr Sie

und zeichnet sie automatisch, sodass Sie sich ganz auf

das Lesen des Preises konzentrieren kΓΆnnen, anstatt Zeichnungen zu verwalten.


──────────────────────────────────────────────────────────

WIE ES FUNKTIONIERT

──────────────────────────────────────────────────────────


Der Indikator verwendet die klassische Williams-Fraktal-Logik zur BestΓ€tigung

von Pivot-Punkten. Ein Fraktalhoch ist nur gΓΌltig, wenn sein Hoch

streng grâßer ist als die umliegenden Kerzen auf beiden Seiten. Ein

Fraktaltief ist nur gΓΌltig, wenn sein Tief streng niedriger ist.

Nach BestΓ€tigung wird von diesem Pivot eine horizontale Linie gezogen

und nach vorne verlΓ€ngert β€” was Ihnen eine klare visuelle Referenz

fΓΌr jedes bedeutende strukturelle Level im Chart gibt.


Kein Repainting. Fraktale werden erst bestΓ€tigt, nachdem genΓΌgend Kerzen

auf beiden Seiten geschlossen haben, sodass Level nie erscheinen und

verschwinden, wΓ€hrend sich der Preis bewegt.


──────────────────────────────────────────────────────────

HAUPTMERKMALE

──────────────────────────────────────────────────────────


β€’ Automatische Fraktalerkennung β€” scannt alle Kerzen beim Laden und

aktualisiert in Echtzeit, wenn neue Kerzen entstehen


β€’ Konfigurierbare Fraktalperiode β€” verwenden Sie Periode 2 fΓΌr jeden

kleinen Swing oder erhâhen Sie sie, um nur die großen

strukturellen Hochs und Tiefs zu isolieren


β€’ Maximallinienkontrolle β€” begrenzt unabhΓ€ngig, wie viele

Widerstands- und UnterstΓΌtzungs-Linien gleichzeitig angezeigt werden,

damit Ihr Chart sauber und auf die jΓΌngste Struktur fokussiert bleibt


β€’ Entfernung gebrochener Level β€” entfernt optional automatisch eine Linie,

wenn der Preis durch sie schließt, sodass nur ungebrochene Level

sichtbar bleiben


β€’ Volle visuelle Kontrolle β€” legen Sie Farbe, Dicke und Linien

stil (Solid, Dash, Dot) unabhΓ€ngig fΓΌr Hochs und

Tiefs fest


β€’ Leichtgewichtig β€” jede Linie wird einmal gezeichnet und nie neu gezeichnet,

so bleibt die Leistung auch auf M1- oder M5-Charts flΓΌssig


──────────────────────────────────────────────────────────

FÜR WEN ES GEEIGNET IST

──────────────────────────────────────────────────────────


Speziell entwickelt fΓΌr Price Action Trader, die Swing-Hochs und -Tiefs

zur Identifikation von Struktur, Planung von Trade-Einstiegen,

Setzen von Stop-Losses und Erkennen potenzieller Umkehr- oder Ausbruchs

Zonen verwenden. Funktioniert mit jedem Symbol und jedem Zeitrahmen in cTrader.


──────────────────────────────────────────────────────────

KOSTENLOS β€” OHNE VERPFLICHTUNGEN

──────────────────────────────────────────────────────────


Frac High Low Lines ist komplett kostenlos. Installieren Sie es, fΓΌgen Sie es

ihrem Chart hinzu und handeln Sie mit klareren Struktur-Leveln ab

Ihrer allerersten Sitzung.


==========================================================

Zusammenfassung

KI-Zusammenfassung
fractal_high_low is an indicator designed for price action traders to automatically identify and plot fractal high and low lines on trading charts. It uses classic Williams fractal logic to detect pivot points where price has reversed or broken structure, confirming fractal highs when a bar’s high is strictly greater than its neighbors, and fractal lows when a bar’s low is strictly lower. Upon confirmation, horizontal lines are drawn from these pivot points and extended forward, providing clear visual references for significant support and resistance levels.
The indicator updates in real time as new bars form and scans all bars on load. It offers configurable fractal periods to capture minor or major swings, controls to limit the number of displayed lines for clarity, and an option to automatically remove lines when price closes through them. Users can customize line color, thickness, and style independently for highs and lows. The indicator is lightweight, drawing each line once to maintain smooth performance even on low timeframes like M1 or M5.
fractal_high_low works on any symbol and timeframe within the cTrader platform and supports markets including Forex, stocks, commodities, indices, and cryptocurrencies. It aids traders in identifying market structure, planning entries, setting stops, and spotting reversal or breakout zones.

Indikatorprofil
Indikatorkategorie
Marktstruktur (SMC)
Ausgabetyp
Signale
Visualisierung
Datenanforderungen
Nur Balken
UnterstΓΌtzte Signale
Level – BerΓΌhrung
Level – Durchbrechen

Kundenbewertungen

0.0
Bewertungen: 0
Kundenbewertungen
Bisher gibt es keine Bewertungen fΓΌr dieses Produkt. Haben Sie es schon ausprobiert? Dann kΓΆnnen Sie die erste Person sein, die andere darΓΌber informiert!

Diskussion

HΓ€ufig gestellte Fragen (FAQ)

BTCUSD
Prop
Forex
Scalping
Indices
EURUSD
Commodities
Crypto
Stocks
XAUUSD
NAS100
Über den cTrader Store verfügbare Produkte, einschließlich Handelsbots, Indikatoren und Plugins, werden von externen Entwicklern bereitgestellt und nur zu Informations- und technischen Zugriffszwecken verfügbar gemacht. cTrader Store ist kein Broker und erbringt keine Anlageberatung, persânlichen Empfehlungen oder eine Garantie für zukünftige Performance.

Das kΓΆnnte Sie auch noch interessieren

Indikator
Forex
Crypto
+2
PREMIUN INDICATOR
Indikator
ATR
RSI
+11
This indicator puts three helpful trading tools on your chart at once. Think of it like having three expert traders
Indikator
Key Levels
Market Structure
+1
HTF Candle Projector displays the current Higher Timeframe candle (4H or 1H) as a real projected candle LIVE..
Indikator
BB Breakout Oscillator with alerts! Spot trend reversals using Bollinger Bands. Bullish/Bearish crossovers Alerts.
Indikator
Forex
Crypto
+3
Detect powerful 2-candle reversal patterns at key highs/lows. Boost entries with real-time alerts and visual signals.
Indikator
AI-assisted
Order Block
+5
The daily bias estimator indicator uses ICT concepts to show whether the chart is bullish or bearish on multi-time frame
β€žVWAP Proβ€œ-Logo
Beste Ratings
5.0
(5)
Kostenlos
Indikator
VWAP
Forex
Advanced VWAP with up to 30 anchored levels, multiple timeframes, memory mode, standard deviation bands & simple GUI
Indikator
Clean trend indicator using CCI & ATR. Highlights up/down trends with adaptive, no-repaint lines.
Indikator
Market Structure
Automatic market structure detection with HH, HL, LH and LL labels directly on the chart.
Indikator
BOS
Key Levels
+2
Maps bullish and bearish order block zones, CE levels and structure-based price action context.
Indikator
Forex
Crypto
+2
HTF Candle
Indikator
Prop
VWAP
+13
Rolling VWAP with dynamic or fixed time window, customizable source price and standard deviation bands.
Indikator
ATR
Key Levels
It combines the trend-filtering power of Renko charts with the volatility tracking of ATR Bands
Indikator
Liquidity Grab
Liquidity Sweep
+2
Visualizes accumulation ranges, manipulation sweeps and distribution phases on your cTrader chart.
Indikator
CHOCH
Key Levels
+5
ZigZag Market Structure Identifier - Multi-Layer Scanner: Convergent Pivot Detection, 4-TF Overlay & Naked Chart Mode.
Indikator
Plot higher-timeframe Bollinger Bands for clearer structure, pullback zones, and breakout signalsβ€”without switching char
Indikator
Key Levels
Market Structure
+1
Sessions, ICT killzones, multi-ORB and previous levels. One clean, no-repaint cTrader overlay.
Indikator
RSI
Signal
+1
Multi-timeframe version of the Quantitative Qualitative Estimation (QQE) indicator.

Preis

Seit 20/09/2025
125.27M
Gehandeltes Volumen
773.83K
Pip-Gewinn
144
Kostenlose Installationen