Beschreibung
🚀 Verwandeln Sie Ihr Renko-Trading mit präziser Docht-Visualisierung
Entdecken Sie die verborgenen Marktdaten, die Standard-Renko-Charts Ihnen nicht zeigen! 📈
✨ Was macht diesen Indikator besonders?
🎯 Echte Tick-Level-Analyse - Im Gegensatz zu anderen Indikatoren, die nur schätzen, analysiert dieses Tool jeden einzelnen Tick innerhalb jedes Renko-Steins, um die tatsächlichen Preisextreme zu offenbaren, die während der Bildung auftraten.
🔍 Sehen Sie, was andere übersehen - Entdecken Sie die echten Hochs und Tiefs, die innerhalb jedes Renko-Steins passiert sind, und erhalten Sie so entscheidende Markteinblicke für bessere Ein- und Ausstiegsentscheidungen.
💪 Hauptmerkmale, die es auszeichnen:
🏗️ Intelligente lokale Speichertechnologie
- Speichert automatisch alle berechneten Dochte in Ihrem lokalen Speicher
- Verlieren Sie niemals Ihre Daten - selbst beim Wechseln von Charts, Zeitrahmen oder Neustart von cTrader
- Intelligentes inkrementelles Laden verhindert die Neuberechnung vorhandener Daten
- Minimale Leistungseinbußen beim Plattformneustart
⚡ Blitzschnelle Leistung
- Progressives Laden Tag für Tag mit Echtzeit-Fortschrittsanzeige
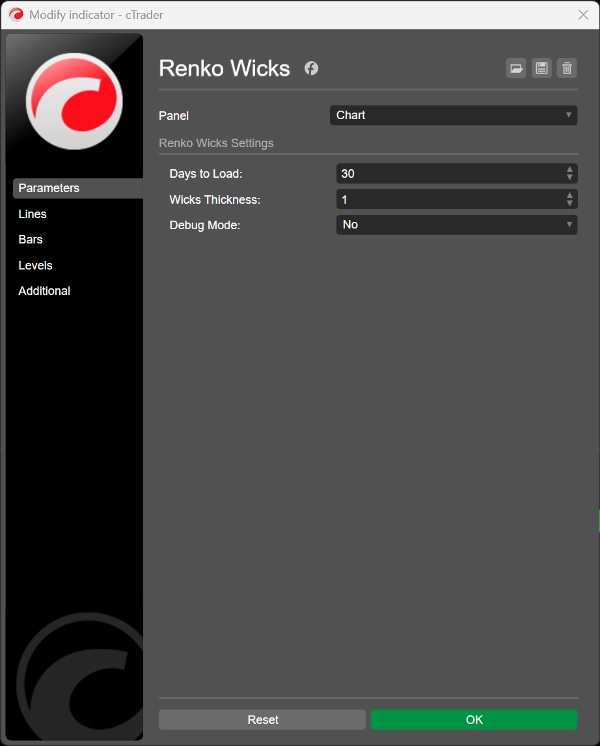
- Konfigurierbare Verlaufsdauer (1+ Tage)
- Optimierte Speichernutzung für reibungslosen Chartbetrieb
🎨 Professionelles visuelles Design
- Passt sich automatisch dem Bullen-/Bären-Farbschema Ihres Charts an
- Verstellbare Dochtstärke (1-5 Pixel) für perfekte Sichtbarkeit
- Saubere, unaufdringliche Darstellung, die Ihre Analyse verbessert
🛡️ Felsenfeste Zuverlässigkeit
- 100% Datenpersistenz - Ihre Dochte überleben Plattformneustarts, Chartwechsel und Zeitrahmenänderungen
- Intelligente Duplikatvermeidung sorgt für saubere Charts
- Eingebaute Fehlerbehandlung für maximale Stabilität
- Debug-Modus für Transparenz und Fehlerbehebung
🎯 Perfekt für:
📊 Daytrader - Erkennen Sie Intraday-Extrema für präzise Scalping-Möglichkeiten
📈 Swing-Trader - Identifizieren Sie wichtige Unterstützungs-/Widerstandsniveaus innerhalb der Renko-Steine
🔄 Analyse mehrerer Zeitrahmen - Jeder Zeitrahmen pflegt seine eigene Docht-Datenbank
🚨 Warum Renko-Dochte wichtig sind:
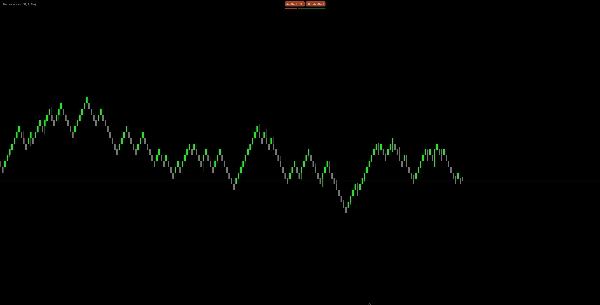
Standard-Renko-Charts zeigen Ihnen nur den Eröffnungs- und Schlusskurs jedes Steins, aber massive Kursbewegungen passieren dazwischen! Dieser Indikator zeigt:
- 📉 Echte Unterstützungs-/Widerstandsniveaus, die der Kurs tatsächlich berührt hat
- 🎪 Marktvolatilitäts-Einblicke innerhalb jeder Steinbildung
- 🎯 Bessere Ein- und Ausstiegspunkte basierend auf tatsächlichen Preisextremen
- 📊 Verbesserte Marktstruktur-Analyse für fundierte Entscheidungen
Erstellt von einem echten Renko-Trader ♥
Zusammenfassung
Key features include smart local storage that preserves calculated wick data across chart switches, timeframes, and platform restarts, ensuring data persistence and minimizing recalculations. The indicator offers fast, progressive day-by-day data loading with configurable history depth and optimized memory usage for smooth performance. Visually, it adapts to the chart’s bull/bear color scheme and allows adjustable wick thickness for clear, non-intrusive display.
Renko Wicks Pro supports multiple timeframes, maintaining separate wick databases for each, making it suitable for day traders seeking precise scalping points and swing traders identifying key levels. It includes built-in error handling, duplicate prevention, and a debug mode for stability and troubleshooting.
By revealing hidden price movements within Renko bricks, this indicator aids in identifying true market structure, improving entry and exit decisions based on actual price extremes.