
Beschreibung
⚠️ Wir sind umgezogen zu 👉 PrimeQuant
🚫🚫🚫 Kaufen Sie diesen Indikator nicht!
⚡ NÄCHSTE GENERATION VERFÜGBAR: Dieses klassische LudwigICT-Werkzeug wurde neu gestaltet, umstrukturiert und unter unserer neuen Entwickler-Marke PrimeQuant neu veröffentlicht. Die neue Version bietet eine optimierte Benutzeroberfläche und aktualisierte Eigenschaften für aktuelle Marktbedingungen. Holen Sie sich die verbesserte Version hier zu einem reduzierten Preis:
👉 Complete ICT SMC Suite - ADR AWR AMR OHLC Fibs EIS SR Alert
👉 Complete ICT SMC Suite - ADR AWR AMR OHLC Fibs EIS SR Alert
👉 Complete ICT SMC Suite - ADR AWR AMR OHLC Fibs EIS SR Alert
(Bitte beachten Sie: Das LudwigICT-Angebot bleibt für Bestandsnutzer aktiv, erhält jedoch keine Updates oder aktive Preisnachlässe mehr.)
🔥 ADVANCED ICT + ADR + AWR SUITE PRO
Hören Sie auf zu raten und sehen Sie den Markt mit institutioneller Klarheit. Die ADVANCED ICT SUITE PRO von LudwigICT ist ein professionelles, all-in-one Charting-Toolkit, das für den anspruchsvollen Price-Action-Trader entwickelt wurde. Sorgfältig konstruiert als stabile und visuell perfekte Nachbildung des legendären Pine Script-Indikators, automatisiert diese Suite die komplexe Aufgabe der Darstellung kritischer Marktstrukturen, sodass Sie sich auf das Wesentliche konzentrieren können: Ihre Strategie und Ausführung.
Dies ist nicht nur ein weiterer Indikator; es ist ein komplettes Framework zur Marktbetrachtung. Durch die nahtlose Integration der Kernkonzepte von ICT wie Preis, Zeit, Volatilität und Momentum bietet diese Suite eine unvergleichliche, institutionelle Sicht auf die Finanzmärkte direkt in Ihrem cTrader-Chart.
Warum die LudwigICT Suite wählen?
- All-in-One Kraftpaket: Dieser einzelne Indikator ersetzt dutzende separate Werkzeuge. Sie erhalten Fibonacci-Analyse, Bereichsprojektionen, mehrstufige Marktstruktur, Kontext höherer Zeitrahmen und Momentum-Farbgebung in einem leichten und effizienten Paket.
- Unerschütterliche Stabilität ist König: Haben Sie schon einmal einen Indikator benutzt, bei dem die Levels beim Scrollen springen und neu gezeichnet werden? Wir haben das gelöst. Unsere proprietäre Smart Anchoring-Logik sorgt dafür, dass Ihre Fibonacci-Level an bedeutenden historischen Wendepunkten fixiert sind und nur dann angepasst werden, wenn sich die Marktstruktur wirklich ändert.
- Visuelle Perfektion & Klarheit: Wir glauben, dass der wertvollste Besitz eines Traders seine Konzentration ist. Diese Suite ist darauf ausgelegt, Klarheit zu verbessern, nicht Unordnung zu schaffen. Die Elemente sind sauber, unaufdringlich und vollständig anpassbar. Die Standardeinstellungen sind sofort für den professionellen Einsatz bereit.
- Präzise Entwicklung für ernsthafte Trader: Jede Berechnung, vom Elder Impulse System bis zur Average Daily Range, wurde rigoros getestet, um eine 1:1-Übereinstimmung mit der originalen, vertrauenswürdigen Pine Script-Logik zu gewährleisten. Keine Abkürzungen, keine Annäherungen.
Wesentliche Funktionen erklärt
Die Suite besteht aus mehreren leistungsstarken, unabhängigen Modulen, die Sie ein- und ausschalten sowie an Ihren individuellen Handelsstil anpassen können.
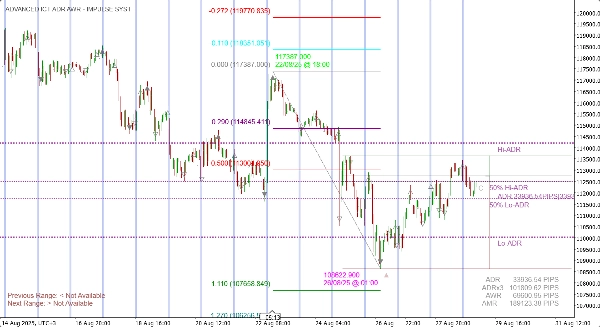
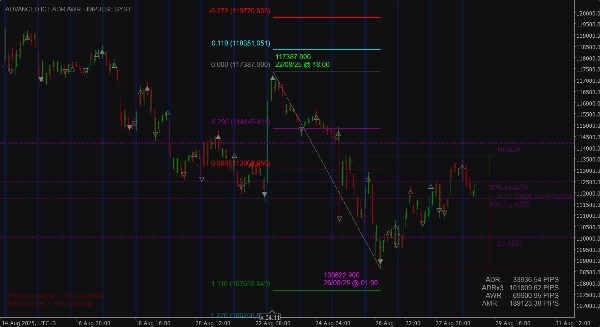
✔️ Stabile & verankerte Fibonacci-Retracement (Das Herzstück der Suite)
Das stabilste und intelligenteste Fibonacci-Werkzeug, das auf cTrader verfügbar ist.
- Smart Anchoring Logik: Erkennt automatisch und fixiert den letzten großen, bedeutenden Swing-Hoch- und Tiefpunkt und bietet so eine stabile und verlässliche Preisspanne für Ihre Analyse.
- Intelligenter Breakout-Reset: Die Fibonacci-Level bleiben verankert, bis der Preis einen entscheidenden Schlusskurs außerhalb der festgelegten Spanne macht (Breakout-Distanz ist vollständig anpassbar). Dies verhindert, dass die Zeichnung bei kleinen Rücksetzern springt und sorgt dafür, dass sie sich nur anpasst, wenn sich die Marktstruktur wirklich verändert hat.
- Die charakteristische gestrichelte Trendlinie: Die ikonische gestrichelte diagonale Linie verbindet die Ankerpunkte Ihrer Fibonacci-Spanne und bietet eine klare visuelle Darstellung des Trends, den Sie analysieren.
- Optionale ZigZag-Überlagerung: Zur zusätzlichen Bestätigung können Sie eine klassische ZigZag-Überlagerung aktivieren, um den Verlauf aller historischen Wendepunkte zu sehen. Diese ist standardmäßig deaktiviert, um ein sauberes Chart zu bewahren.
✔️ Elder Impulse System (Momentum-Balken-Farbgebung)
Erfassen Sie sofort den dreifachen Konsens des Marktes: Trend, Momentum und Kraft.
- Grüne Balken: Zeigen einen bullischen Konsens an (13 EMA steigend & MACD Histogramm steigend). Der Markt befindet sich in einem starken Aufwärtstrend.
- Rote Balken: Zeigen einen bärischen Konsens an (13 EMA fallend & MACD Histogramm fallend). Der Markt befindet sich in einem starken Abwärtstrend.
- Blaue Balken: Zeigen einen neutralen Zustand oder Uneinigkeit zwischen Trend und Momentum an. Eine Zeit für Vorsicht.
- Balkenränder: Ein subtiler, aber wichtiger Aspekt. Um jeden Balken wird ein farbiger Rand gezogen, der seine wahre Richtung (bullischer oder bärischer Schluss) zeigt, was für eine genaue Kerzenanalyse unerlässlich ist, wenn die Hauptfarbe überschrieben wird.
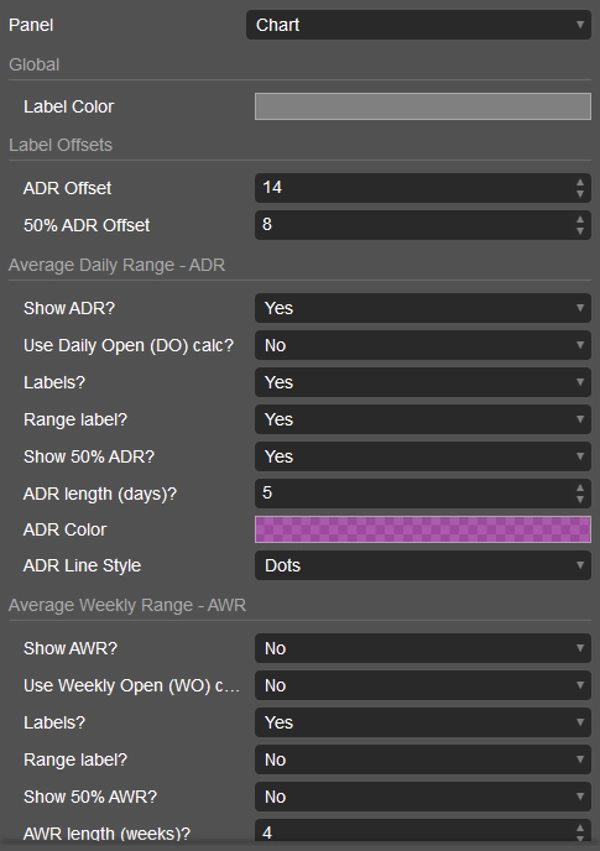
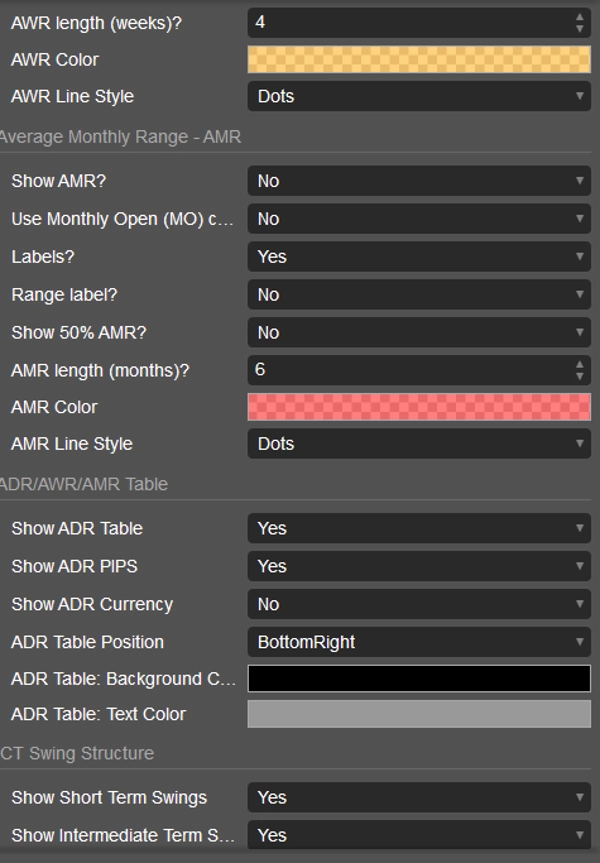
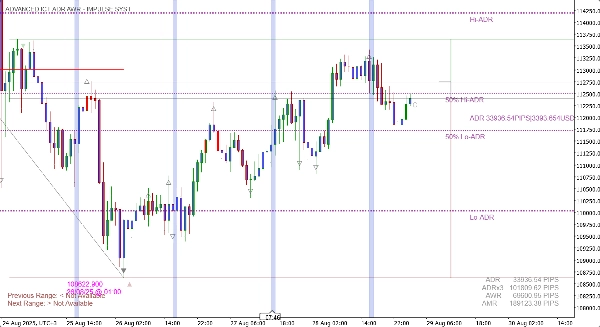
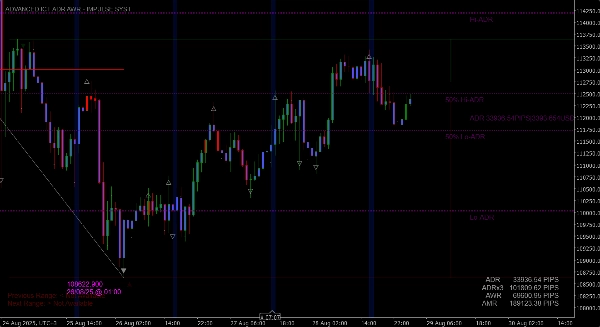
✔️ Erweiterte Bereichsprojektionen (ADR, AWR, AMR)
Kennen Sie die Grenzen Ihres Instruments und setzen Sie realistische Tages-, Wochen- und Monatsziele.
- Dynamische Projektionen: Berechnet und zeichnet automatisch die Average Daily Range, Average Weekly Range und Average Monthly Range.
- Prognostizierte Hochs & Tiefs: Zeigt prognostizierte Unterstützungs- und Widerstandsniveaus basierend auf den berechneten Bereichen.
- 50% Mittelpunkte: Wichtig zur Identifikation von Gleichgewichtspunkten und potenziellen Umkehrpunkten innerhalb des prognostizierten Bereichs.
- On-Screen-Datentabelle: Eine saubere, anpassbare Tabelle zeigt alle wichtigen Bereichswerte in Pips und/oder Währung für eine schnelle Übersicht.
✔️ Mehrstufige Marktstruktur (ST, IT, LT Swings)
Hören Sie auf, Swing-Punkte manuell zu zeichnen. Der Indikator übernimmt das für Sie.
- Automatische Identifikation: Zeichnet kurzfristige (ST), mittelfristige (IT) und langfristige (LT) Swing-Hochs und -Tiefs direkt in Ihr Chart.
- Klare Symbole: Verwendet ein einfaches und intuitives System aus Punkten und Dreiecken zur Darstellung der Hierarchie der Marktstruktur.
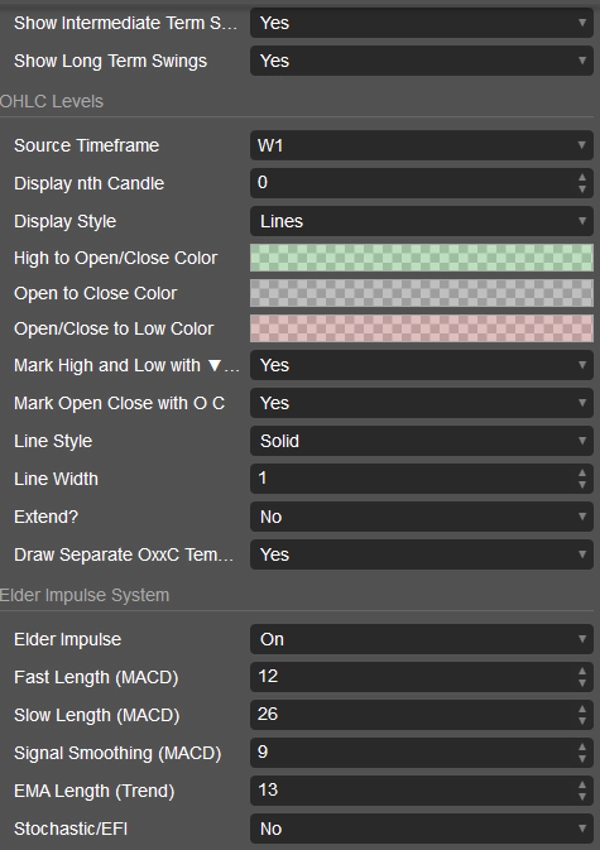
✔️ OHLC-Level höherer Zeitrahmen
Handeln Sie mit Multi-Timeframe-Kontext, ohne Ihr Chart zu verlassen.
- Wichtige Preisniveaus: Überlagern Sie Open, High, Low und Close von jedem höheren Zeitrahmen (z.B. wöchentlich, täglich) als saubere Linien oder schattierte Kästen.
- Sitzungsanalyse: Sehen Sie sofort, wo sich der aktuelle Preis im Verhältnis zu den wichtigen Niveaus des Vortages oder der Vorwoche befindet.
✔️ Dynamische Unterstützungs- & Widerstandswerkzeuge
- Gann S/R-Level: Ein kraftvolles, mathematisch abgeleitetes Set von Unterstützungs- und Widerstandslinien, das sich an die Volatilität des Instruments anpasst.
- Digital Root Time: Hebt spezifische, vordefinierte Zeitfenster mit vollflächigen vertikalen Balken hervor, die sich dynamisch anpassen, wenn Sie scrollen und zoomen, sodass sie immer sichtbar sind.
Wie man die ADVANCED ICT SUITE PRO benutzt
Diese Suite ist ein vielseitiges Toolkit, kein einfacher "Kauf/Verkauf"-Signalindikator. Hier sind einige Möglichkeiten, es in Ihren Handel zu integrieren:
- Handel mit hoher Wahrscheinlichkeit durch Konfluenz:
-
- Warten Sie, bis der Preis in ein wichtiges Fibonacci-Level zurückzieht (z.B. das 0.618 oder 0.786 Level) innerhalb eines stabilen, verankerten Trends.
- Suchen Sie nach Konfluenz: Passt dieses Fib-Level zu einem OHLC-Level höherer Zeitrahmen oder einer Gann S/R-Linie?
- Nutzen Sie das Elder Impulse System als Auslöser für Ihren Einstieg. Warten Sie, bis die Balkenfarbe zu Ihren Gunsten wechselt (z.B. von blau/rot zu grün für einen Long-Einstieg), bevor Sie den Trade ausführen.
- Setzen Sie Ihre Gewinnziele auf das nächste Fib-Extensions-Level oder das prognostizierte ADR/AWR Hoch/Tief.
- Trendbestätigung und Momentum-Einstiege:
-
- Identifizieren Sie den Gesamtrend mit den Marktstruktur Swing-Punkten (z.B. eine Serie höherer Hochs und höherer Tiefs).
- Warten Sie während eines Rückzugs, bis die Elder Impulse Farbe blau (neutral) wird.
- Steigen Sie in den Trade ein, sobald die Farbe wieder in Trendrichtung wechselt (grün für Aufwärtstrend, rot für Abwärtstrend)
- Handel von Bereichs- und Sitzungsumkehrungen:
-
- Beobachten Sie, wie der Preis sich einer wichtigen Grenze nähert, wie dem prognostizierten ADR-Hoch oder dem Hoch des Vortages.
- Suchen Sie nach Erschöpfungszeichen, wie z.B. dass der Preis nicht über das Niveau schließt und die Elder Impulse Farbe blau wird oder zur entgegengesetzten Farbe wechselt.
- Gehen Sie eine Umkehr-Position ein, mit Ziel auf das 50% ADR-Level oder die andere Seite des Bereichs.
Vollständige Liste der anpassbaren Parameter
(Dieser Abschnitt gibt Kunden Vertrauen in die Flexibilität des Produkts)
- Globale Einstellungen: Beschriftungsfarben, Versätze.
- Average Daily Range (ADR): Ein-/Ausschalten, Tagesöffnung verwenden, Beschriftungen anzeigen, Bereich anzeigen, 50%-Level anzeigen, Rückblickperiode, Farbe, Linienart.
- Average Weekly Range (AWR): Vollständig anpassbare Einstellungen, wie bei ADR.
- Average Monthly Range (AMR): Vollständig anpassbare Einstellungen, wie bei ADR.
- Datentabelle: Ein-/Ausschalten, Pips anzeigen, Währung anzeigen, Bildschirmposition, Farben.
- ICT Marktstruktur: ST-, IT- und LT-Swings unabhängig ein-/ausschalten.
- OHLC-Level: Quellzeitrahmen, Kerzenrückblick, Anzeigeart (Linien/Kästen), alle Farben, Hochs/Tiefs markieren, Öffnung/Schluss markieren, Linien verlängern, Vorlage anzeigen.
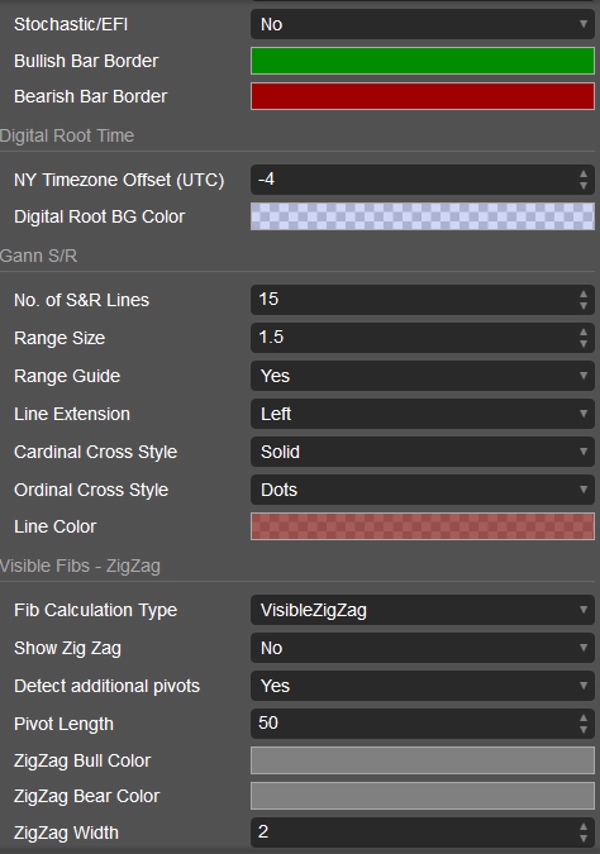
- Elder Impulse System: Ein-/Ausschalten, alle MACD- und EMA-Parameter, Stochastik/EFI-Modus, bullische/bärische Balkenrandfarben.
- Digital Root Time: NY-Zeitzonenversatz, Hintergrundfarbe.
- Gann S/R: Anzahl der Linien, Bereichsgröße, Linienverlängerung, Linienstile, Farbe.
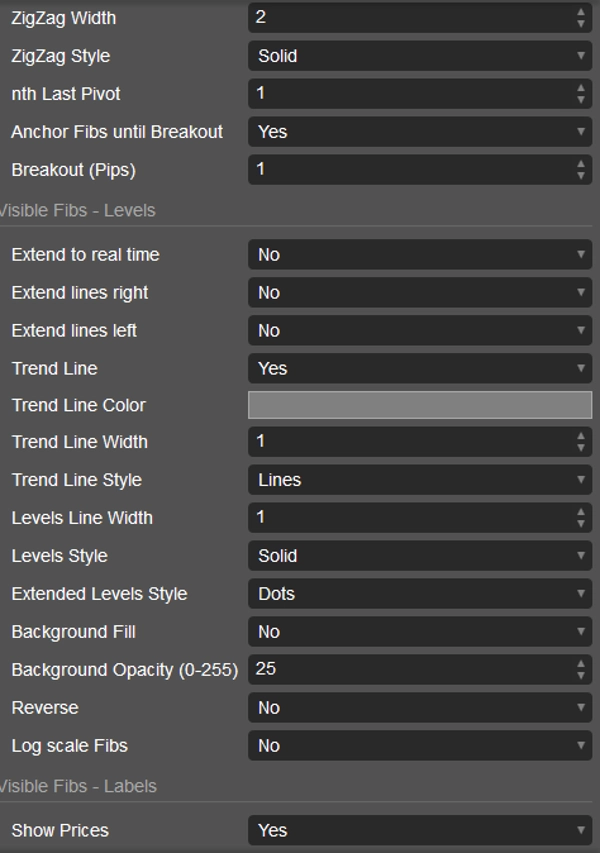
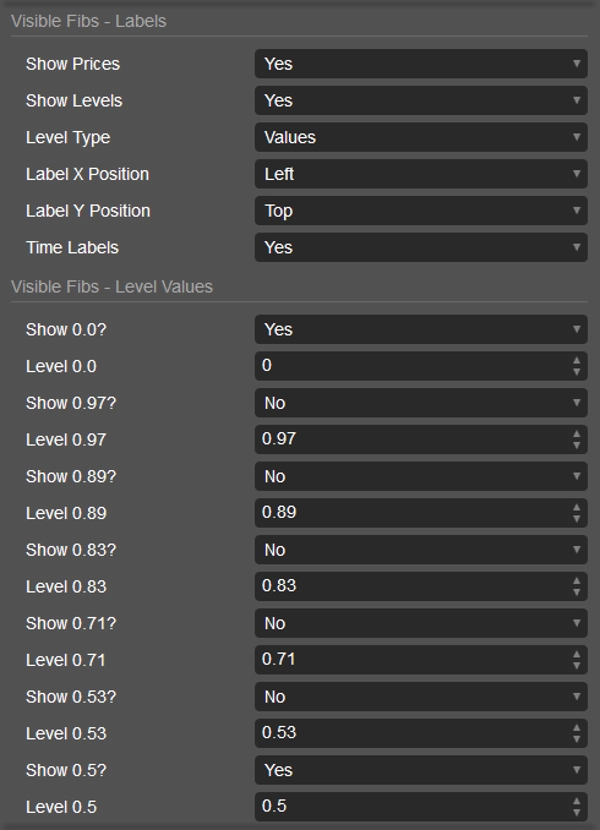
- Sichtbare Fibs: Berechnungstyp (ZigZag/Chart-Bereich), ZigZag anzeigen (standardmäßig aus), alle ZigZag-Parameter, stabile Verankerung & Breakout-Reset, alle Level- und Linienparameter, Hintergrundfüllung, Umkehrung, Log-Skala, Beschriftungskontrollen und über 25 einzelne Fibonacci-Level, die ein- und ausgeschaltet, angepasst und umgefärbt werden können.
Verbessern Sie Ihren Handel mit dem ultimativen Price-Action-Toolkit. Hören Sie auf, Linien zu zeichnen, und beginnen Sie, die Setups zu sehen. Holen Sie sich noch heute die ADVANCED ICT SUITE PRO von LudwigICT! 🚀🚀🚀
Wenn Sie Fragen haben oder auf Probleme stoßen, können Sie mich gerne kontaktieren. Ich helfe Ihnen gerne!
Haftungsausschluss:
Durch die Nutzung meiner Algorithmen erkennen Sie an, dass der Handel mit Risiken verbunden ist und vergangene Leistungen keine Garantie für zukünftige Ergebnisse darstellen. Es ist unerlässlich, dass Sie eine solide Risikomanagementstrategie haben und vor allem diszipliniert die Stop-Loss-Level einhalten. Eine mangelhafte Risikosteuerung kann zu erheblichen Verlusten führen. Ich übernehme keine Verantwortung für finanzielle Ergebnisse, die aus der Nutzung dieser Algorithmen resultieren. Handeln Sie verantwortungsbewusst und befolgen Sie stets die richtigen Risikomanagementpraktiken.
Alles Gute! 🙌
Zusammenfassung
Kundenbewertungen
5 | 50 % | |
4 | 50 % | |
3 | 0 % | |
2 | 0 % | |
1 | 0 % |


