present
Registrieren Sie sich und erhalten Sie $50 Rabatt auf Ihren ersten Kauf
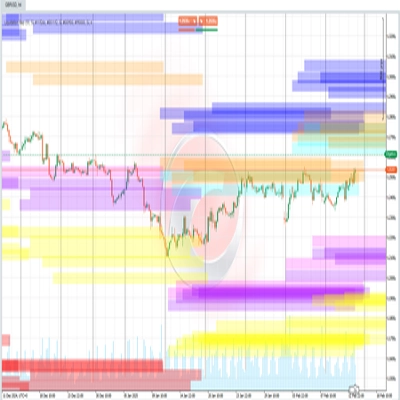
Trading product for ICT Concepts from TradingView Indikator Fibonacci Forex, image 2
Trading product for ICT Concepts from TradingView Indikator Fibonacci Forex, image 3
Trading product for ICT Concepts from TradingView Indikator Fibonacci Forex, image 4
Trading product for ICT Concepts from TradingView Indikator Fibonacci Forex, image 5
Trading product for ICT Concepts from TradingView Indikator Fibonacci Forex, image 6
Trading product for ICT Concepts from TradingView Indikator Fibonacci Forex, image 7
Trading product for ICT Concepts from TradingView Indikator Fibonacci Forex, image 8

Beschreibung

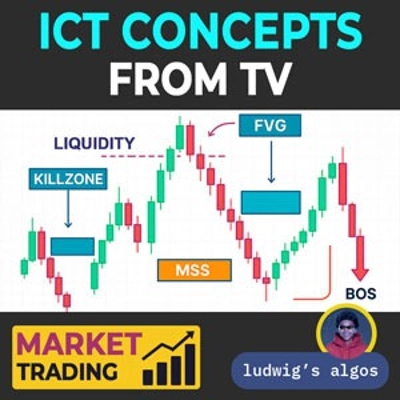
ICT KONZEPTE von LudwigICT (cTrader-Äquivalent der beliebten ICT-Konzepte von TradingView)

Erleben Sie institutionelle Präzision mit ICT Konzepten — einer vollständigen Suite von Smart Money-Tools, die den Markt so visualisieren, wie es Profis tun.


🔹 Funktionen

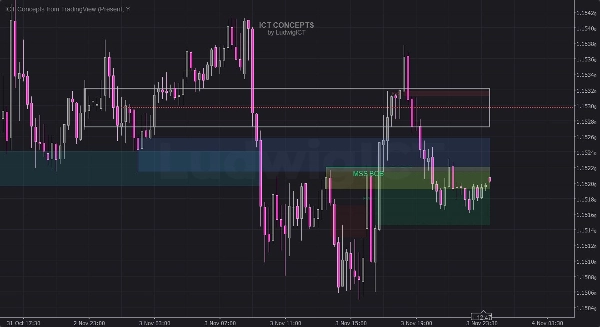
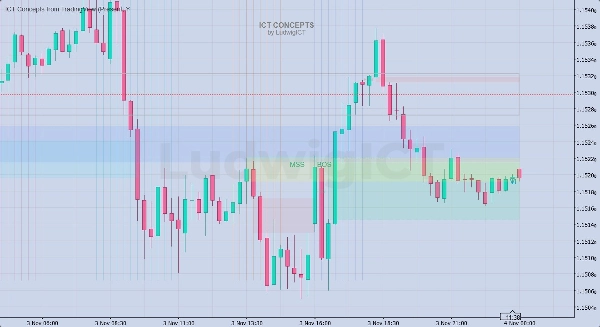
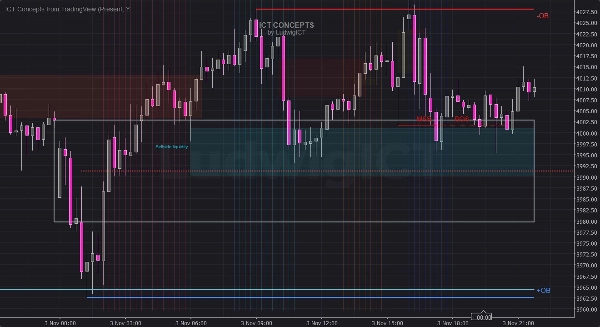
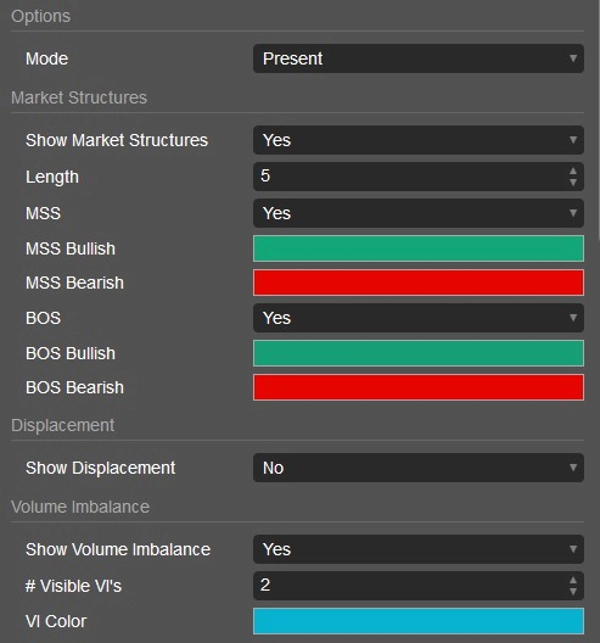
  • 📈 Marktstruktur-Erkennung — automatische BOS (Break of Structure) und MSS (Market Structure Shift) Hervorhebungen, die sich in Echtzeit an die Kursbewegung anpassen.
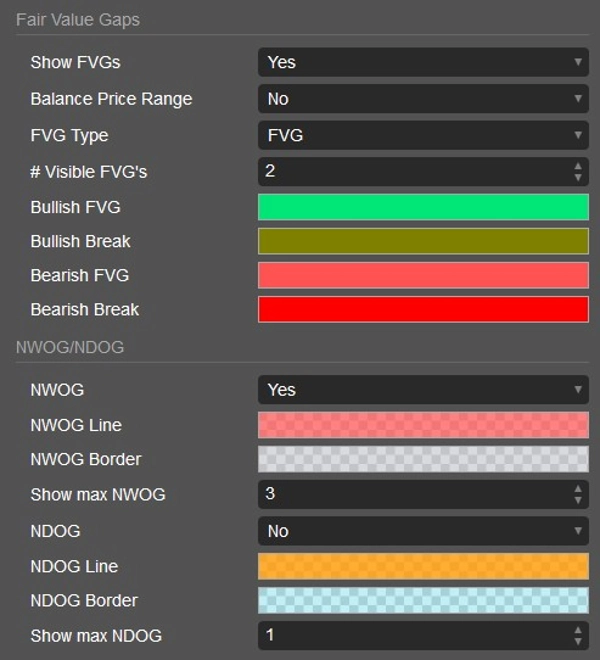
  • 🟩 Fair Value Gaps (FVG) & Balance Price Ranges (BPR) — erkennen Sie sofort Premium- und Discount-Zonen, genau wie in professionellen ICT-Modellen.
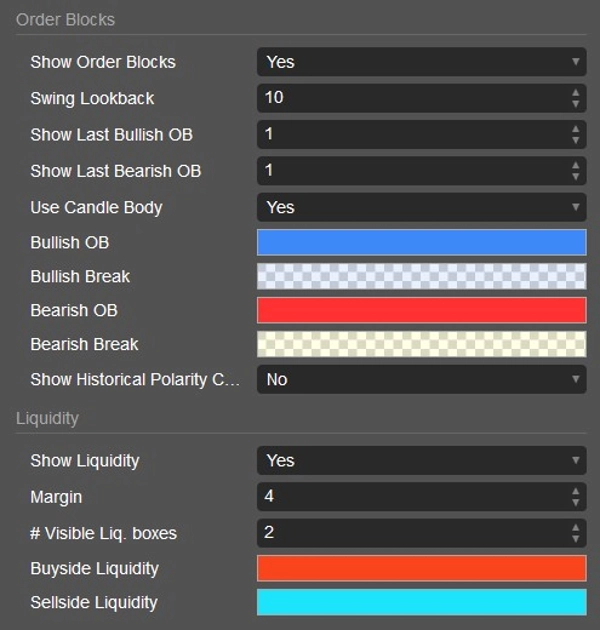
  • 💧 Liquiditätszonen — markiert automatisch Buyside- und Sellside-Liquiditätspools, in denen der Kurs wahrscheinlich sucht oder reagiert.
  • 🧱 Orderblöcke (OB) — identifiziert bullische und bärische Orderblöcke und verfolgt, ob sie halten oder brechen.
  • ⚡ Volumenungleichgewicht & Verschiebungskerzen — zeigen institutionelle Stärke und Ineffizienz zwischen Käufern und Verkäufern.
  • 🌅 NWOG / NDOG Gaps — zeigt wöchentliche und tägliche Eröffnungslücken, um fehlende Kursbereiche hervorzuheben.
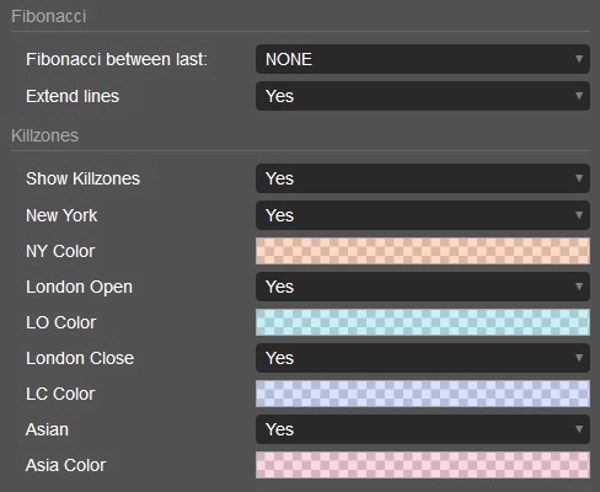
  • 🕓 Killzones-Overlay — zeigt London-, New York- und Asien-Sitzungen für zeitbasierte Konfluenz.
  • 🔢 Integrierte Fibonacci-Ziele — zeichnet automatisch Retracements und Projektionen, die mit Ihrer gewählten Struktur übereinstimmen.


🧭 Wie man es benutzt

  1. Hängen Sie den Indikator an ein beliebiges Chart an und belassen Sie die Standardeinstellungen — er passt sich automatisch Ihrem Symbol und Zeitrahmen an.
  2. Kombinieren Sie mehrere Konzepte: Suchen Sie beispielsweise nach BOS + FVG + OB Ausrichtung für Setups mit hoher Wahrscheinlichkeit.
  3. Verwenden Sie es, um das Kursverhalten rund um Liquiditätspools, Verschiebungskerzen und wöchentliche Lücken zu studieren.
  4. Für Intraday-Trader aktivieren Sie Killzones, um sich auf die aktivsten Sitzungen zu konzentrieren.
  5. Passen Sie Sichtbarkeitsgrenzen an (wie „Sichtbare FVGs“ oder „Max NWOG“), um die gewünschte Chartklarheit zu erreichen.

Dieses Tool funktioniert nahtlos über Forex, Indizes, Rohstoffe, Krypto und Aktien — perfekt für Analyse und Ausführung.


⚙️ Warum die Ergebnisse bei Brokern oder TradingView leicht variieren können
cTrader verwendet die Serverzeit, Symbol-Feeds und Datenaggregation Ihres Brokers, während TradingView oft komposite oder synthetische Feeds nutzt.
Kleine Unterschiede bei Kerzenschlüssen, Wochenend-Datenverarbeitung oder Bruchteilspreisen können die Position von Strukturen (wie BOS oder OB) leicht verschieben.
Dies ist bei Handelsplattformen normal und beeinträchtigt nicht die zugrunde liegende Logik oder Zuverlässigkeit der Konzepte.


⚠️ Haftungsausschluss
Dieser Indikator ist ein professionelles Analysetool — keine Finanzberatung.
Führen Sie stets Ihre eigene Analyse durch und verwalten Sie das Risiko verantwortungsbewusst, bevor Sie Trades platzieren

Zusammenfassung

KI-Zusammenfassung
ICT Concepts from TradingView is a comprehensive indicator designed for cTrader that integrates key Smart Money tools to analyze market behavior with institutional precision. It automatically detects and highlights market structure elements such as Break of Structure (BOS) and Market Structure Shift (MSS) in real time. The indicator identifies Fair Value Gaps (FVG) and Balance Price Ranges (BPR) to pinpoint premium and discount zones. It marks liquidity zones, including buy-side and sell-side pools, where price reactions are likely. Order Blocks (OB) are tracked to determine bullish or bearish control and their status. Additional features include volume imbalance and displacement candles to reveal institutional strength and inefficiencies, weekly and daily opening gaps (NWOG/NDOG) to highlight missing price areas, and Killzones overlay showing major trading sessions (London, New York, Asian) for time-based analysis. Integrated Fibonacci targets automatically plot retracements and projections aligned with market structure. The tool adapts automatically to any symbol and timeframe, supporting Forex, Indices, Commodities, Crypto, and Stocks. Users can customize visibility settings and combine multiple concepts for detailed price behavior study and trade analysis. Differences in data feeds across brokers or platforms may cause slight variations in displayed structures but do not affect the indicator’s core logic.

Diskussion

Kundenbewertungen

4.5
Bewertungen: 2
5
50 %
4
50 %
3
0 %
2
0 %
1
0 %
Kundenbewertungen
November 14, 2025
November 10, 2025

Häufig gestellte Fragen (FAQ)

Fibonacci
Forex
Signal
Breakout
Fair Value Gap
SMC
VWAP
cBot
Forex
Crypto
+4
Indikator
ATR
RSI
+5
cBot
Prop
Forex
+8
Indikator
Signal
Stocks
+5
Indikator
ATR
EMA
+5
Indikator
SMC
Prop
+5
Indikator
Prop
Forex
+9
Indikator
SMC
VWAP
+5
Indikator
Forex
EURUSD
+5
Indikator
SMC
Forex
+5
Indikator
ATR
Prop
+5
Indikator
EMA
Forex
+5
Indikator
Prop
Indikator
Forex
Indices
+5
Indikator
Imbalance
Key Levels
+2
Indikator
ATR
RSI
+2
Indikator
RSI
VWAP
+5
Indikator
RSI
Breakout
+1
Indikator
SMC
VWAP
+4
Indikator
Indikator
RSI
Forex
+5
Indikator
EMA
MACD
+5
Indikator
VWAP
Support & Resistance
Indikator
AI
ATR
+27
Indikator
Doji
Wedge
+5
Indikator
Volume
Key Levels
+1
Indikator
RSI
Signal
+3
Indikator
Prop
Forex
+14
Indikator
Fair Value Gap
Liquidity Grab
+2
Indikator
EMA
Supertrend
+4

Preis