
RSI + EMA Crossover Signals
지표
3 구매
버전 1.0, Oct 2025
Windows, Mac
4.0
리뷰: 2
설명
⚠️ 저희는 👉 PrimeQuant
🚫🚫🚫 이 지표를 구매하지 마세요!
🎯 개요
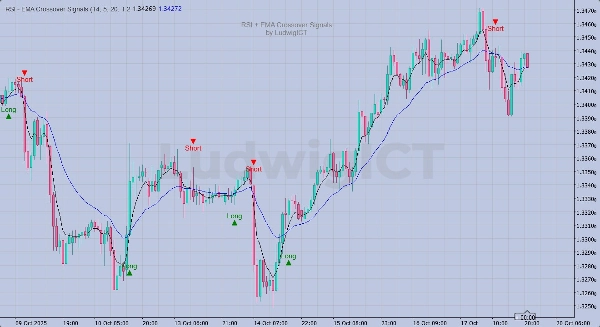
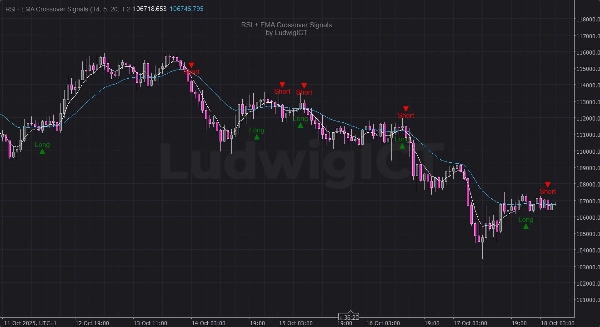
이 RSI + EMA 교차 신호 지표는 LudwigICT에 의해 만들어졌으며, 모멘텀과 추세 확인을 결합하여 차트에서 직접 높은 신뢰도의 롱/숏 거래 신호를 생성합니다.
⚙️ 작동 원리:
- RSI 신호 단계:
-
- RSI가 자체 SMA 신호선을 교차할 때 신호가 준비됩니다.
- EMA 확인 단계:
-
- 빠른 EMA와 느린 EMA가 같은 방향으로 교차할 때만 신호가 발동됩니다.
- 신호 취소:
-
- 반대 방향의 교차(RSI 또는 EMA)가 발생하면 발동되지 않은 신호가 취소됩니다.
✨ 주요 특징:
- 🔁 이중 확인 논리 (RSI + EMA)
- 📈 차트에 직접 표시되는 명확한 롱 및 숏 아이콘
- ⚡ 변동성에 자동 조정되는 동적 ATR 기반 시각적 오프셋
- 💧 영구 워터마크 브랜딩이 있는 깔끔한 오버레이
- 🧠 잘못된 발동을 줄이기 위한 스마트한 “준비” 및 “취소” 논리
- 🧮 완전 조정 가능한 RSI, EMA 및 오프셋 매개변수
🔧 입력값:
- RSI 기간 (기본값: 14)
- 빠른 EMA (기본값: 5)
- 느린 EMA (기본값: 20)
- 신호 오프셋 (ATR 배수, 기본값: 1.2)
📊 이상적인 대상:
- 모멘텀 트레이더
- 추세 확인 시스템
- 수동 또는 반자동 거래 전략
📅 버전 업데이트:
- ✅ 더 명확한 시각화를 위한 ATR 기반 동적 오프셋 추가
- ✅ 신호 정확도 논리 개선
- ✅ 진위 확인을 위한 제거 불가능한 워터마크 추가
© 2025 LudwigICT — 판권 소유.
질문이 있거나 문제가 발생하면 언제든지 연락 주세요. 기꺼이 도와드리겠습니다!
면책 조항:
제 알고리즘을 사용함으로써 거래에는 본질적인 위험이 따르며 과거 성과가 미래 결과를 보장하지 않는다는 점을 인정하는 것입니다. 견고한 위험 관리 전략을 갖추는 것이 필수적이며, 무엇보다도 손절매 수준을 엄격히 준수하는 것이 중요합니다. 위험 관리를 제대로 하지 않으면 상당한 손실이 발생할 수 있습니다. 저는 이 알고리즘 사용으로 인한 재정적 결과에 대해 책임지지 않습니다. 책임감 있게 거래하고 항상 적절한 위험 관리 관행을 따르시기 바랍니다.
행운을 빕니다! 🙌
요약
지표 프로필
지표 카테고리
모멘텀
출력 유형
시각화
신호
필터
데이터 요구 사항
막대만
지원되는 신호
크로스
변동성
추세 강도
고객 리뷰
4.0
리뷰: 2
5 | 0 % | |
4 | 100 % | |
3 | 0 % | |
2 | 0 % | |
1 | 0 % |
상담
자주 묻는 질문(FAQ)
Forex
Signal
Scalping
EURUSD
RSI
XAUUSD
ATR
트레이딩 봇, 지표, 플러그인 등 cTrader Store에서 제공되는 상품은 제3자 개발자에 의해 제공되며, 이는 단순히 정보 및 기술적 접근을 목적으로 제공된 것입니다. cTrader Store는 중개인이 아니며, 투자 조언, 개인별 추천 또는 향후 성과에 대한 어떠한 보장도 제공하지 않습니다.
이 작성자의 상품 더 보기


좋아하실 만한 다른 항목


가격
17.89M
거래량
60.07K
핍 수익
125
판매
4.91K
무료 설치