
Descripción
Descubra una comprensión más profunda de la dinámica del mercado Forex con el completo indicador de Fuerza Relativa de Moneda (RCS), diseñado específicamente para la plataforma cTrader.
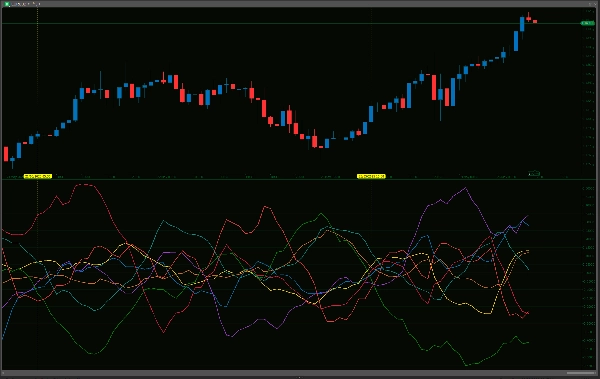
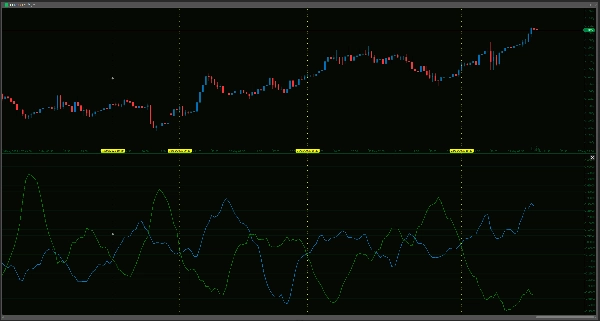
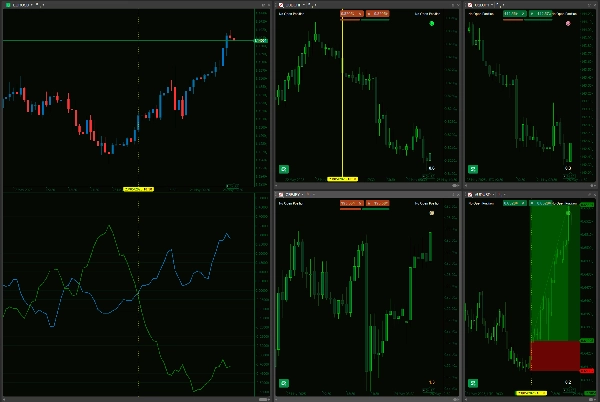
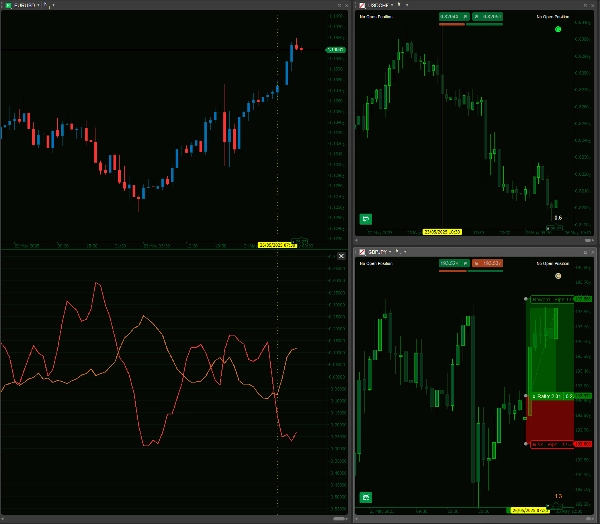
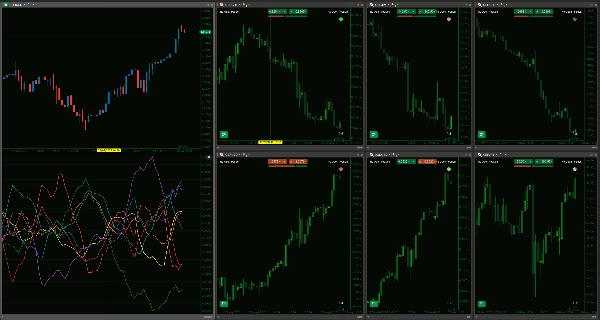
Esta poderosa herramienta evalúa meticulosamente el rendimiento individual de ocho monedas principales—AUD, USD, EUR, JPY, GBP, CAD, CHF y NZD—analizando su cambio porcentual entre sí a través de una cesta de 28 pares de divisas. Con períodos de retroceso y suavizado definidos por el usuario, puede ajustar la sensibilidad del indicador para alinearla con su enfoque único de trading, desde scalping rápido hasta estrategias a largo plazo. La salida visual clara permite una comparación inmediata y rápida, ayudándole a identificar rápidamente las monedas que muestran un fuerte impulso alcista o aquellas que muestran signos de debilidad, lo cual puede ser fundamental para seleccionar pares de divisas con mayor potencial para sus estrategias. Ofrece una forma de ir más allá del análisis de un solo par y ver el panorama general de qué monedas individuales están realmente impulsando los movimientos del mercado.
Sin embargo, es crucial usar este indicador con una comprensión clara de sus capacidades y limitaciones. El indicador RCS es una herramienta analítica sofisticada, no un dispositivo infalible de predicción ni un sistema de trading completo de 'configurar y olvidar'. Sus cálculos se basan en datos históricos de precios y están destinados a complementar, no sustituir, su metodología de trading establecida, que siempre debe incluir un análisis exhaustivo de la acción del precio, consideración de factores fundamentales y prácticas robustas de gestión de riesgos. Aunque las líneas resaltan la 'fuerza' o 'debilidad', estas lecturas requieren una interpretación cuidadosa dentro del contexto más amplio del mercado; por ejemplo, una moneda que muestra una 'fuerza' extrema podría estar acercándose a una condición de sobrecompra o a un nivel clave de resistencia.
El rendimiento del indicador también puede fluctuar con las condiciones prevalecientes del mercado (por ejemplo, puede comportarse de manera diferente en mercados con tendencia fuerte frente a mercados laterales y volátiles), y su precisión depende de que su plataforma tenga datos históricos suficientes y limpios para los 28 pares de divisas involucrados. Aunque está optimizado para cálculos continuos, la carga inicial de datos para un análisis tan completo de cruces de divisas puede ser exigente para los recursos de la plataforma, especialmente en conexiones lentas o hardware menos potente. Al proporcionar una perspectiva matizada y multimoneda, este indicador RCS se ofrece como una ayuda valiosa para ayudarle a tomar decisiones de trading más informadas y estratégicamente sólidas y potencialmente mejorar su ventaja en la competitiva arena Forex, en lugar de como una solución independiente.
Por favor, verifique que su bróker ofrezca todos los pares cruzados incluidos en este indicador para que funcione correctamente.
--------------------------
¡No dude en consultar mis otros indicadores!
https://ctrader.com/products/1181
https://ctrader.com/products/1182
https://ctrader.com/products/1180
https://ctrader.com/products/1015
https://ctrader.com/products/555
https://ctrader.com/products/553
https://ctrader.com/products/554
https://ctrader.com/products/552
https://ctrader.com/products/557
https://ctrader.com/products/845
https://ctrader.com/products/848
https://ctrader.com/products/847
https://ctrader.com/products/846
https://ctrader.com/products/551
https://ctrader.com/products/574
https://ctrader.com/products/573
https://ctrader.com/products/556
https://ctrader.com/products/558
https://ctrader.com/products/559
https://ctrader.com/products/560
Resumen
The indicator provides a clear visual representation of currency strength and weakness, enabling traders to identify currencies with strong momentum or signs of weakness at a glance. This multi-currency perspective helps move beyond single-pair analysis to understand which currencies are driving market movements.
The tool relies on historical price data and requires all relevant currency pairs to be available from the broker. Its performance may vary with market conditions, and it is intended to complement, not replace, comprehensive trading strategies that include price action, fundamental analysis, and risk management. Initial data loading can be resource-intensive due to the breadth of cross-currency calculations.
This indicator serves as an analytical aid to support more informed Forex trading decisions by highlighting relative currency strength across major pairs.
Valoraciones de clientes
5 | 33 % | |
4 | 67 % | |
3 | 0 % | |
2 | 0 % | |
1 | 0 % |


