Descripción
MoneyMasters - Indicador de Barras HTF
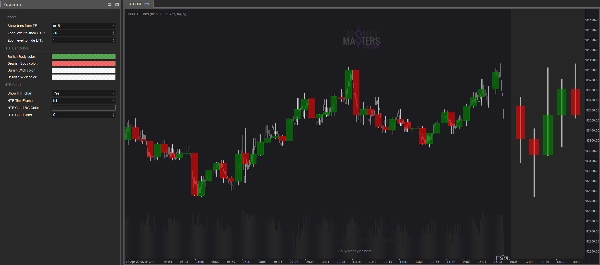
Mejora tu experiencia de trading con el Indicador MM-HTF Bars, una herramienta potente diseñada para cTrader que superpone sin problemas los datos de velas de marcos temporales superiores (HTF) en tu gráfico actual. Este indicador proporciona una representación visual clara de la acción del precio HTF, ayudándote a tomar decisiones de trading más informadas al combinar múltiples marcos temporales en una sola vista.
Características clave:
- Marco Temporal Personalizable: Elige el marco temporal superior (por ejemplo, 15 minutos, 1 hora) para mostrar directamente en tu gráfico.
- Control Dinámico de Zoom: Oculta o muestra automáticamente las barras HTF y de marcos temporales inferiores (LTF) según el nivel de zoom de tu gráfico para una experiencia sin desorden.
- Velas Codificadas por Color: Distingue fácilmente entre velas alcistas y bajistas HTF con colores personalizables para el cuerpo y la mecha.
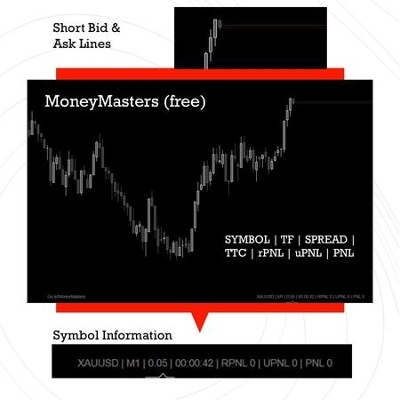
- Visualización Precisa: Muestra los niveles de apertura, máximo, mínimo y cierre HTF con una alineación precisa en la línea de tiempo de tu gráfico.
- Integración Perfecta: Funciona como una superposición, asegurando que tu gráfico permanezca limpio y fácil de leer.
Beneficios:
- Obtén una comprensión más profunda de las tendencias del mercado analizando la acción del precio HTF junto con los datos LTF.
- Mejora tu estrategia de trading identificando niveles clave de soporte y resistencia HTF.
- Ahorra tiempo y esfuerzo eliminando la necesidad de cambiar entre múltiples gráficos.
Ya seas scalper, trader diario o swing trader, el Indicador MM-HTF Bars es una herramienta esencial para mejorar tu análisis de mercado y proceso de toma de decisiones.
¡Comienza a operar de manera más inteligente hoy!
----------
Actualización 1.02 / 25041201:
- MINI GRÁFICO HTF - ahora muestra un mini gráfico en el lado derecho con velas HTF. Puedes elegir un marco temporal diferente y el número de velas a mostrar.
----------
Actualización 1.01 / 25040901:
- Funcionamiento más fluido - ahora el indicador se actualiza al cambiar el zoom, no en cada tick.
- El indicador puede cambiar las velas en pausa en Market Reply.
Resumen
Valoraciones de clientes
5 | 100 % | |
4 | 0 % | |
3 | 0 % | |
2 | 0 % | |
1 | 0 % |