
Descripción
¡Descubre Zonas de Trading de Alta Probabilidad con Advanced Supply Demand!
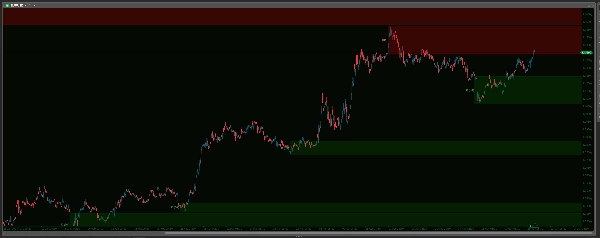
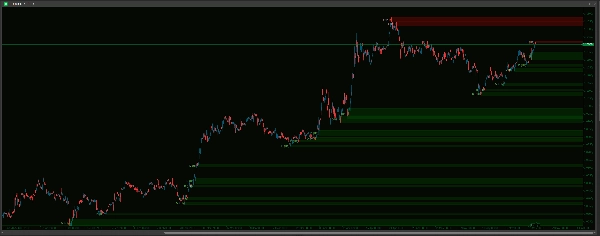
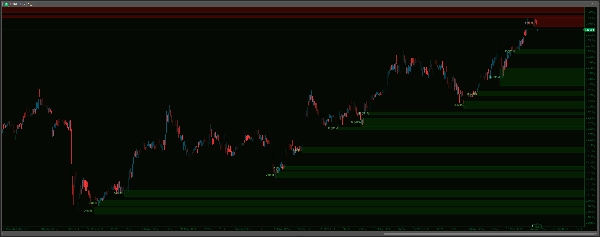
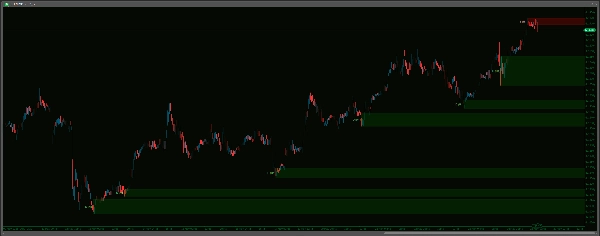
Obtén una visión más clara del mercado con el indicador Advanced Supply Demand Zones V2 . Esta potente herramienta identifica y resalta automáticamente áreas cruciales de oferta y demanda en tu gráfico, potencialmente señalando dónde pueden ocurrir reacciones significativas de precio. Con un sofisticado algoritmo de detección de puntos de giro, capacidades multi-timeframe (MTF) y amplias opciones de personalización, puedes adaptar el indicador perfectamente a tu estilo de trading. Gestiona las zonas eficazmente con opciones para eliminar áreas rotas o coincidentes, aplicar límites de tiempo y mantener tu gráfico limpio. Mejora tu análisis con apariencias personalizables de las zonas, etiquetas claras de timeframe y un robusto sistema de alertas sonoras – completo con un buffer de datos en vivo para evitar ruido histórico – asegurando que seas notificado de acercamientos clave de precio a tus zonas definidas. ¡Lleva tu análisis técnico al siguiente nivel y toma decisiones de trading más informadas!
-------------------
Mejoras respecto a la V1:
Advanced Supply Demand V2 ofrece mejoras significativas para una experiencia de trading más precisa, amigable y efectiva:
- Alertas Más Inteligentes y Silenciosas – ¡Adiós al Ruido Histórico!
-
- Las alertas se activan con la acción del precio en tiempo real después de cargar, eliminando las molestas alertas históricas. Además, elige tus sonidos desde un menú desplegable, un gran avance respecto a escribir nombres de archivos. También tienes Máximo de Alertas por Zona para evitar spam de notificaciones.
- Configuración Sin Esfuerzo – ¡Ajustes Simplificados!
-
- Disfruta de una configuración mucho más intuitiva con menús desplegables para la mayoría de opciones (Timeframes, opciones Sí/No, Estilos de Línea, Archivos de Sonido). ¡Hazlo bien a la primera, siempre!
- Lógica y Gestión de Zonas Más Clara – ¡Menos Desorden, Más Claridad!
-
- Optimizado para un enfoque más directo y accionable. La V2 usa reglas claras para eliminar zonas rotas, maneja inteligentemente zonas superpuestas (coincidentes) para mantener tu gráfico ordenado, y ofrece un simple vencimiento basado en tiempo para zonas antiguas, además de una opción para limitar el número de zonas mostradas.
- Control Visual Superior – ¡Tu Gráfico, a Tu Manera!
-
- Obtén control granular con configuraciones de apariencia separadas (Color, Grosor, Estilo) para zonas de Oferta y Demanda. Ajusta los visuales precisamente a tu preferencia y haz que las zonas sean interactivas en tu gráfico.
- ¡Definición de Zona Más Flexible!
-
- Ahora incluye la opción
IncludeBarBody, que te permite elegir entre zonas solo con mechas o zonas que incorporan el cuerpo de la vela para una perspectiva de mercado potencialmente más amplia y diferente.
- Ahora incluye la opción
-------------------
Guía de Configuración: Advanced Supply Demand Zones
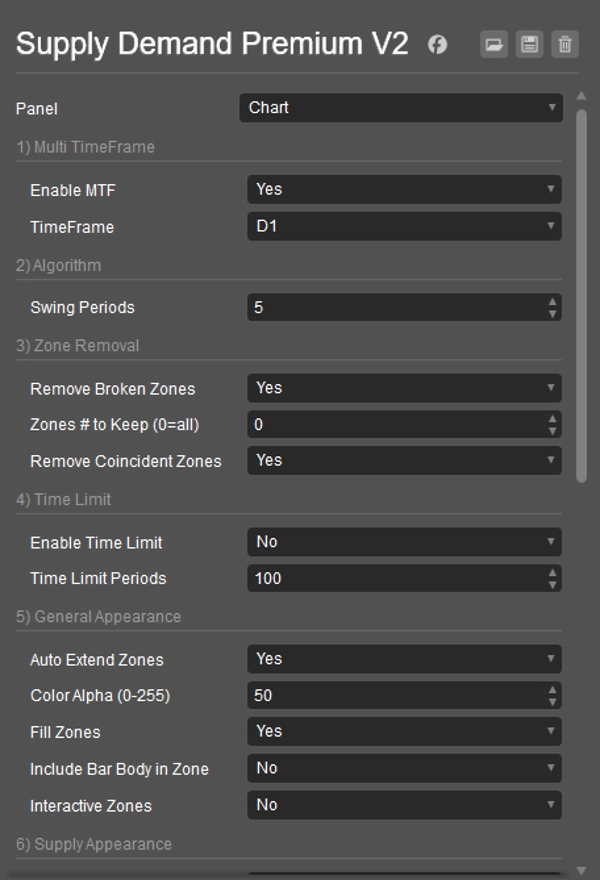
1) Multi TimeFrame
- Habilitar MTF: Sí para ver zonas de un timeframe diferente en tu gráfico actual. No para zonas del gráfico actual.
- TimeFrame: Si MTF es Sí, elige aquí el otro timeframe (por ejemplo, zonas H4 en un gráfico M15).
2) Algoritmo
- Períodos de Swing: Define cuántas barras determinan un giro fuerte del mercado (punto de swing) para crear zonas. Números más altos significan zonas más fuertes (y usualmente menos).
3) Eliminación de Zonas
- Eliminar Zonas Rotas: Sí para borrar automáticamente zonas una vez que el precio las atraviesa claramente.
- Número de Zonas a Mantener (0=todas): Limita cuántas de las zonas más recientes se muestran.
0muestra todas. - Eliminar Zonas Coincidentes: Sí para eliminar automáticamente la zona más antigua si dos zonas se superponen mucho, manteniendo el gráfico más limpio.
4) Límite de Tiempo
- Habilitar Límite de Tiempo: Sí para hacer que zonas muy antiguas desaparezcan automáticamente.
- Períodos de Límite de Tiempo: Si el límite de tiempo está habilitado, se eliminarán zonas más antiguas que esta cantidad de barras.
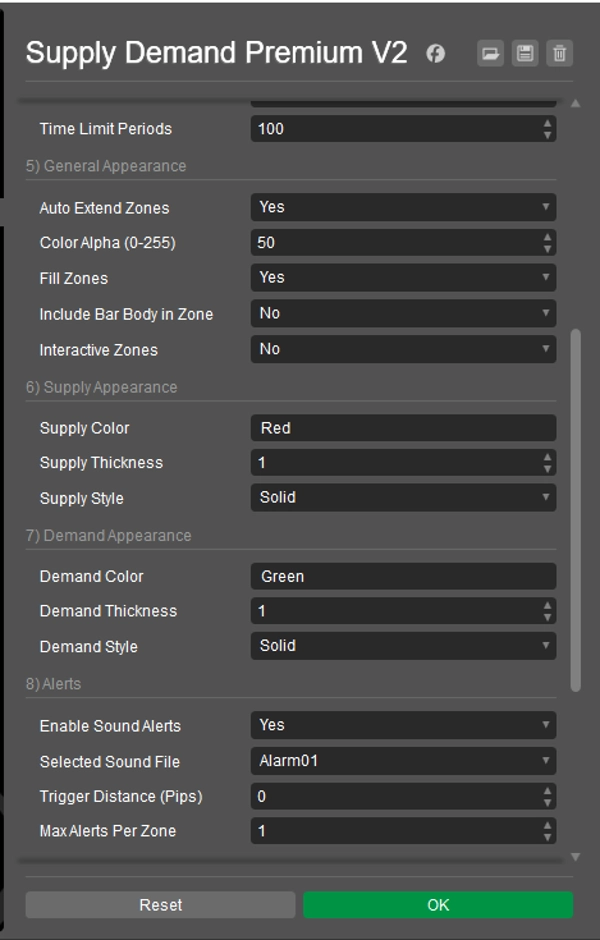
5) Apariencia General
- Extender Zonas Automáticamente: Sí para dibujar zonas hacia el futuro. No para zonas más cortas.
- Alfa de Color (0-255): Define qué tan transparentes son los colores de las zonas (0 = invisible, 255 = sólido).
- Rellenar Zonas: Sí para rellenar las zonas con color. No solo contornos.
- Incluir Cuerpo de Barra en Zona: Sí para usar el cuerpo de la vela (más mechas) para el ancho de la zona. No para usar solo las mechas.
- Zonas Interactivas: Sí para permitir que hagas clic y muevas zonas en el gráfico.
6) Apariencia de Oferta
- Color de Oferta: Define el color para zonas de oferta (superiores). (por ejemplo, "Rojo", "#FF0000")
- Grosor de Oferta: Define el grosor de la línea del borde para zonas de oferta.
- Estilo de Oferta: Define el estilo de línea del borde (Sólido, Puntos, etc.) para zonas de oferta.
7) Apariencia de Demanda
- Color de Demanda: Define el color para zonas de demanda (inferiores). (por ejemplo, "Verde", "#00FF00")
- Grosor de Demanda: Define el grosor de la línea del borde para zonas de demanda.
- Estilo de Demanda: Define el estilo de línea del borde (Sólido, Puntos, etc.) para zonas de demanda.
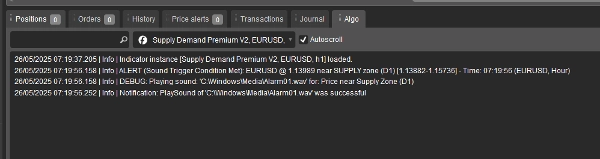
8) Alertas Nota: Para evitar alertas en datos antiguos o justo al iniciar, las alertas sonoras solo se activarán después de que hayan ocurrido 20 ticks de precio en vivo desde que el indicador se cargó en tu gráfico.
- Habilitar Alertas Sonoras: Sí para activar notificaciones sonoras cuando el precio se acerca a una zona.
- Archivo de Sonido Seleccionado: Elige el sonido que quieres escuchar para las alertas. Los sonidos del sistema (como "Alarm01") intentan reproducirse desde
C:\Windows\Media\; asegúrate de que el archivo exista y que cTrader pueda acceder a él. "cTraderDefaultAlert" usa un sonido estándar de cTrader. "Ninguno" no reproduce sonido. - Distancia de Activación (Pips): Qué tan cerca (en pips) debe estar el precio del borde de una zona para activar una alerta.
- Máximo de Alertas por Zona: Limita cuántas veces sonará una alerta para la misma zona.
9) Etiqueta de TimeFrame
- Mostrar Etiqueta de TimeFrame: Sí para mostrar el timeframe (por ejemplo, H1, D1) en cada zona.
- Color de Etiqueta de Oferta: Color del texto para etiquetas de zonas de oferta.
- Color de Etiqueta de Demanda: Color del texto para etiquetas de zonas de demanda.
- Desplazamiento X de Etiqueta (Barras): Ajusta la posición horizontal de la etiqueta desde el inicio de la zona.
- Tamaño de Fuente de Etiqueta: Define el tamaño del texto de la etiqueta.
10) Otros
- Limpieza al Iniciar: Sí para eliminar dibujos antiguos de este indicador cuando cTrader inicia o se añade el indicador a un gráfico.
- Reidentificar Zonas Eliminadas: (Esta configuración tiene un impacto directo limitado en la versión actual. Las zonas se reevalúan en cada tick; si se cumplen los criterios para una zona nuevamente y no se considera rota, reaparecerá independientemente de que esta configuración sea Sí o No).
----------------------------
No dudes en revisar mis otros indicadores:
https://ctrader.com/products/1181
https://ctrader.com/products/1182
https://ctrader.com/products/1180
https://ctrader.com/products/1015
https://ctrader.com/products/555
https://ctrader.com/products/553
https://ctrader.com/products/554
https://ctrader.com/products/552
https://ctrader.com/products/557
https://ctrader.com/products/845
https://ctrader.com/products/848
https://ctrader.com/products/847
https://ctrader.com/products/846
https://ctrader.com/products/551
https://ctrader.com/products/574
https://ctrader.com/products/573
https://ctrader.com/products/556
https://ctrader.com/products/558
https://ctrader.com/products/559
https://ctrader.com/products/560
Resumen
Visual customization is granular, with separate settings for supply and demand zone colors, thickness, and line styles. Zones can be configured to include candle wicks only or both wicks and bodies, providing flexible market perspectives. Interactive zones allow users to click and move zones directly on the chart.
The alert system is designed to minimize noise by triggering notifications only on live price action after the indicator loads, with configurable sound options and limits on alert frequency per zone. Timeframe labels can be displayed on zones with customizable appearance settings.
Additional features include automatic cleanup of old drawings on startup and options to re-identify zones dynamically. This indicator aims to enhance technical analysis by clearly marking high-probability trading zones for more informed decision-making.
Valoraciones de clientes
5 | 0 % | |
4 | 100 % | |
3 | 0 % | |
2 | 0 % | |
1 | 0 % |


