
MACD Histogram PRO
Indicador
4 compras
Versión 1.0, Oct 2025
Windows, Mac
4.5
Valoraciones: 2
Descripción
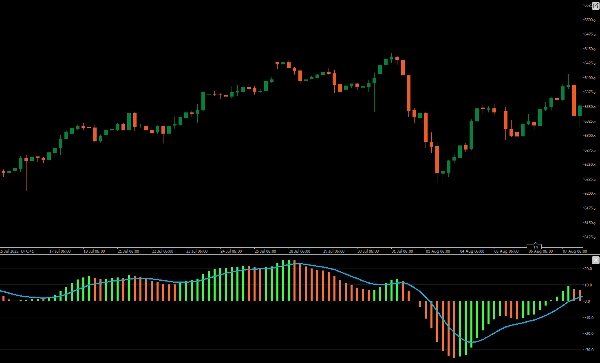
Presentamos el mejorado Histograma MACD, diseñado para ofrecer una experiencia de trading más clara y perspicaz.
Este indicador mejorado muestra un histograma vibrante y colorido que diferencia entre cambios de precio alcistas y bajistas, yendo más allá del formato de un solo color predeterminado. Al usar colores distintos para movimientos positivos y negativos, ofrece una señal visual inmediata de las condiciones del mercado, facilitando la interpretación de cambios en el impulso y posibles reversiones de tendencia.
Perfecto para traders que buscan mayor claridad y precisión, esta mejora del Histograma MACD transforma tu gráfico en una herramienta analítica más potente. Eleva tu estrategia de trading con el mejorado Histograma MACD.
Resumen
Resumen de IA
MACD Histogram PRO is an enhanced technical indicator designed to improve the visualization of the traditional MACD histogram. It displays a vibrant, color-coded histogram that clearly differentiates bullish and bearish price movements, providing immediate visual cues on market momentum and potential trend reversals. This indicator supports analysis across various markets and symbols including Forex (EURUSD, GBPUSD, NZDUSD, USDJPY), cryptocurrencies (BTCUSD, crypto), commodities (XAUUSD, gold, oil, silver), indices (NAS100, SP500, DAX, Dow), and stocks. By using distinct colors for positive and negative momentum shifts, it aids traders in interpreting market conditions with greater clarity and precision. The MACD Histogram PRO is suitable for strategies involving signals and scalping, enhancing chart analysis for more informed trading decisions.
Perfil del indicador
Valoraciones de clientes
4.5
Valoraciones: 2
5 | 50 % | |
4 | 50 % | |
3 | 0 % | |
2 | 0 % | |
1 | 0 % |
Valoraciones de clientes
October 22, 2025
the only reason it stays interesting is one quick look should not become the only input, and 1.5R target is the line to watch.
October 17, 2025
Conversación
Preguntas frecuentes
BTCUSD
Forex
Signal
Indices
EURUSD
Commodities
GBPUSD
NZDUSD
Prop
Scalping
Crypto
Stocks
XAUUSD
NAS100
MACD
USDJPY
Los productos disponibles a través de cTrader Store, incluidos bots, indicadores y plugins para operar, son proporcionados por desarrolladores de terceros y están disponibles únicamente con fines informativos y de acceso técnico. cTrader Store no es un bróker, por lo que no proporciona asesoramiento de inversión, recomendaciones personales ni ninguna garantía de rentabilidad futura.


![Logotipo de "[Hamster-Coder] Moving Average MTF"](https://cdn.ctrader.com/image/webp/b11b98b1-194d-4b8e-b00e-d611826ad159_31226)


Precio
Desde 25/09/2025
25
Ventas
315
Instalaciones gratis