
Descripción
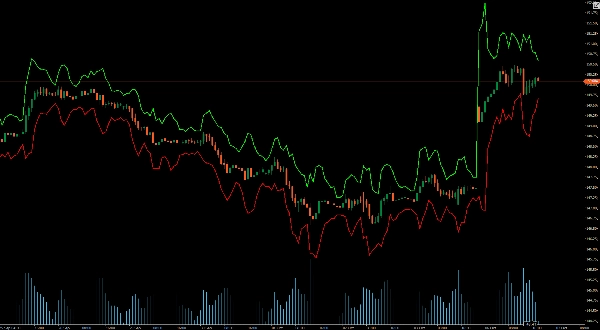
Bandas ATR muestran dinámicamente bandas superiores e inferiores en tus gráficos de precios.
Estas bandas ofrecen información en tiempo real sobre la volatilidad del mercado, ayudándote a identificar con precisión posibles puntos de ruptura y reversión. Perfectas para traders de todos los niveles, las Bandas ATR mejoran tu proceso de toma de decisiones al proporcionar señales visuales claras para establecer stop-loss, take-profits y optimizar puntos de entrada.
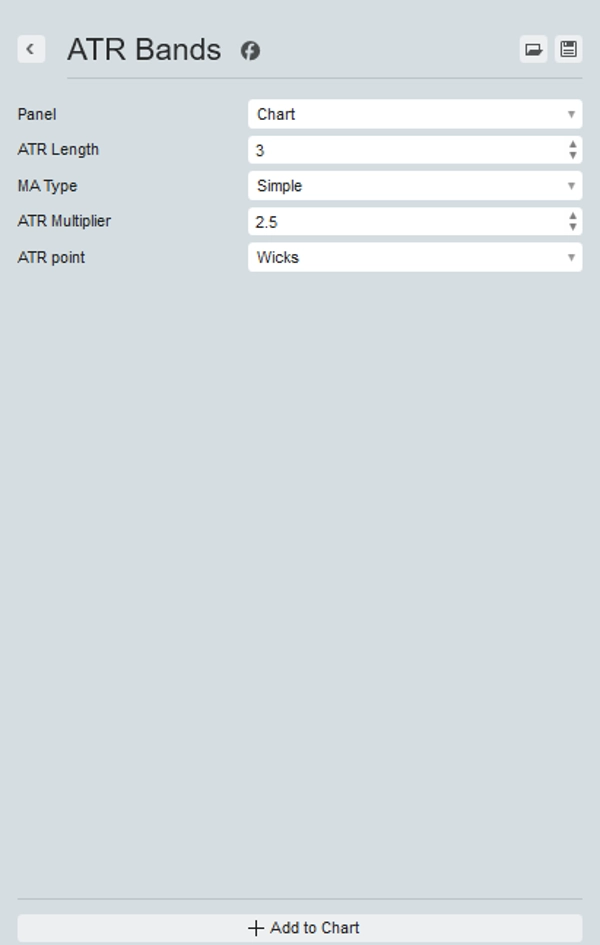
La configuración permite elegir tu período y multiplicador preferidos, cambiar el promedio móvil usado para calcular el ATR y usar mechas de velas o el cierre de la vela.
Mejora tu conjunto de herramientas de trading hoy y experimenta la diferencia con las Bandas ATR – tu ventaja en el mercado.
Resumen
Valoraciones de clientes
5 | 67 % | |
4 | 33 % | |
3 | 0 % | |
2 | 0 % | |
1 | 0 % |


![Logotipo de "Gaussian Channel [Iridio Capital]"](https://cdn.ctrader.com/image/webp/7c039209-5573-4a54-a072-f9528b503103_41960)


