Descripción
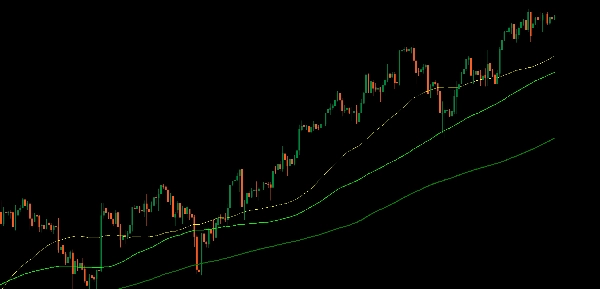
Presentamos el indicador Media Móvil mejorado, diseñado para una mejor personalización y flexibilidad en tu análisis de trading.
Esta versión mejorada también soporta medias móviles de marcos temporales superiores a marcos temporales de ticks y Heikin Ashi. Los períodos Renko y Range aún no son compatibles.
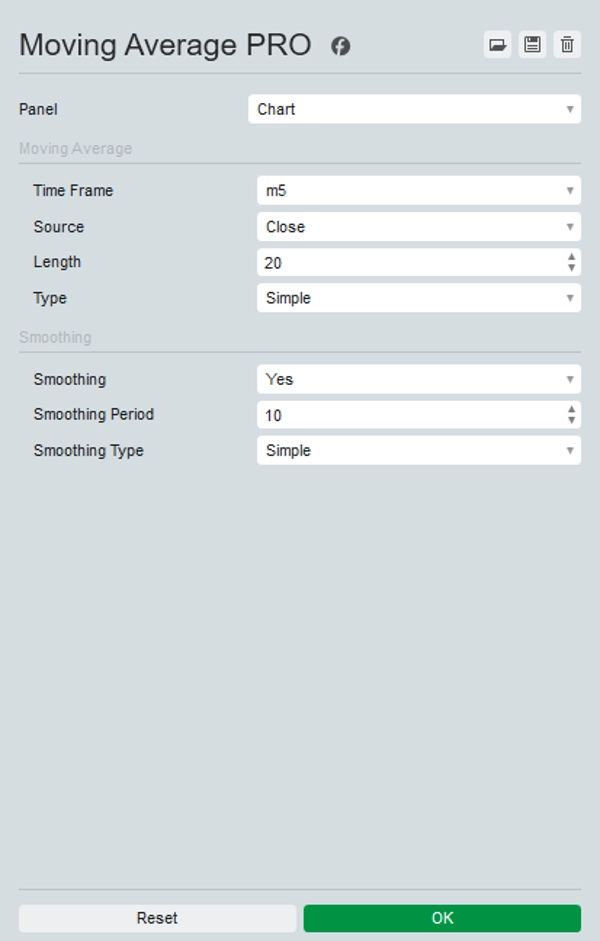
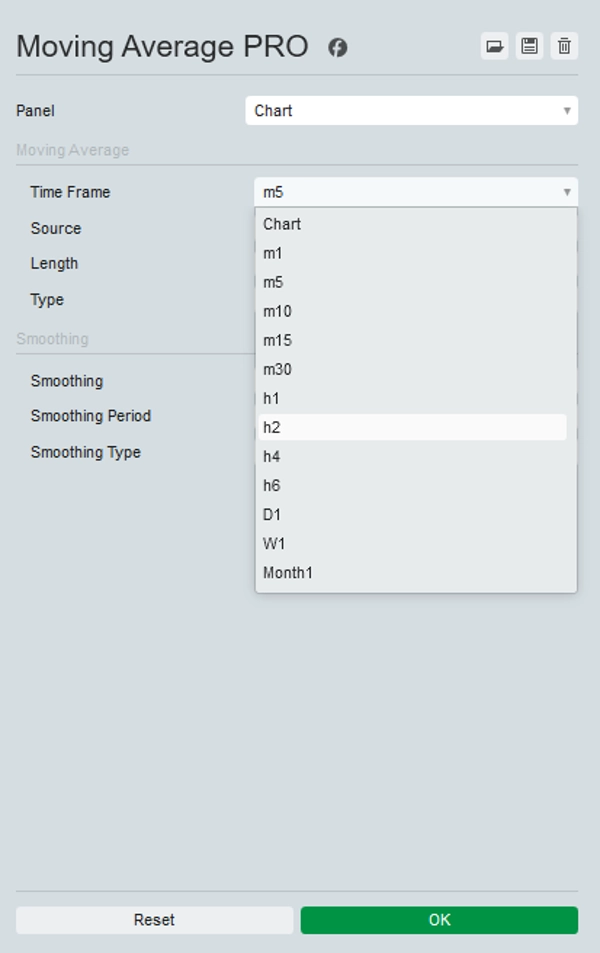
Este indicador te permite elegir cualquier marco temporal, permitiéndote mostrar, por ejemplo, la MA 200 diaria en cualquier otro marco temporal.
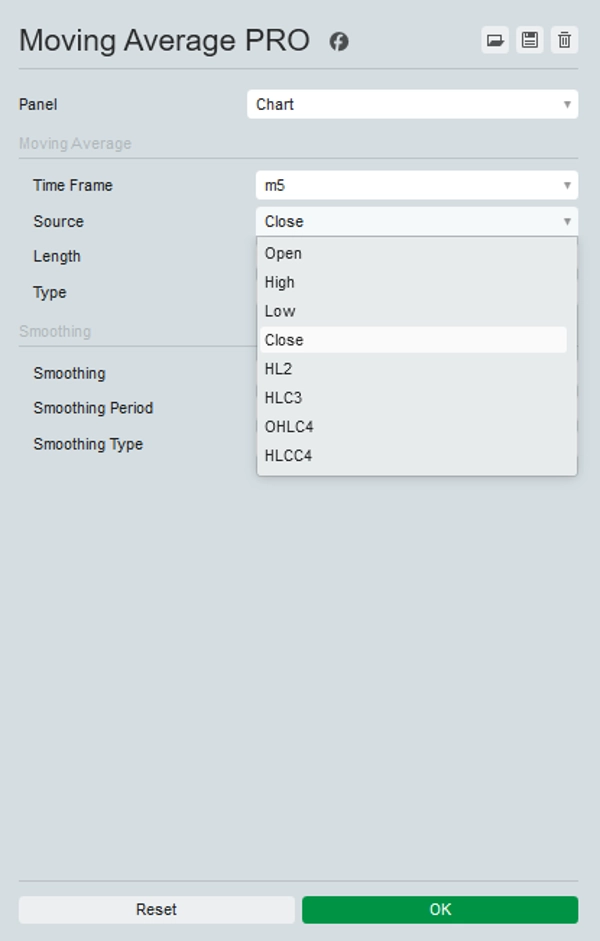
Además, ofrece una variedad de fuentes de precio para seleccionar, incluyendo Apertura, Alto, Bajo, Cierre, HL2, HLC3, OHLC4, y HLCC4, tal como en TradingView, además de opciones de suavizado opcionales para abordar problemas de muestreo en marcos temporales inferiores.
Al ofrecer estas opciones, puedes adaptar la Media Móvil para ajustarla a tu estrategia de trading específica y obtener insights más precisos sobre las tendencias del mercado.
Mejora tu conjunto de herramientas de trading con el indicador Media Móvil mejorado para un análisis y toma de decisiones superiores.
Resumen
Valoraciones de clientes
5 | 100 % | |
4 | 0 % | |
3 | 0 % | |
2 | 0 % | |
1 | 0 % |