

Volume Profile Fixed Range - Pro
指标
12 购买
版本 2.0, Jul 2026
Windows 版、Mac 版
4.3
评价:3
Trading product for Volume Profile Fixed Range - Pro 指标 XAUUSD, image 2
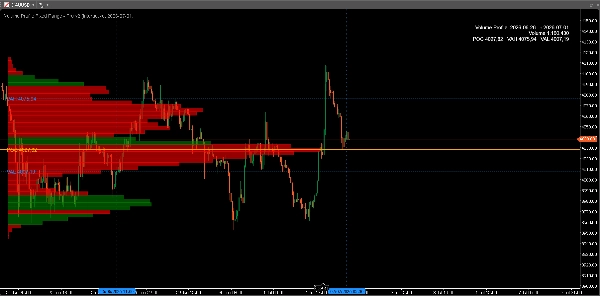
Trading product for Volume Profile Fixed Range - Pro 指标 XAUUSD, image 3
注册日期 09/04/2025
14
销售

说明

固定区间成交量剖面 — 专业版


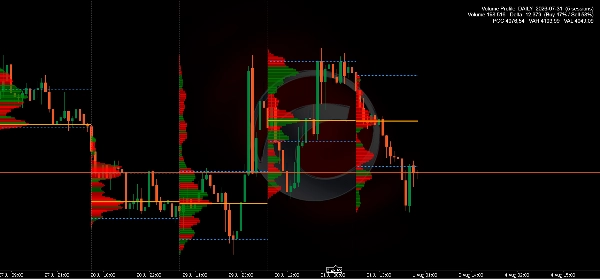
大多数指标告诉你价格去了哪里。成交量剖面告诉你市场实际交易的位置——买卖双方真正成交量的水平。这些水平在行情结束后仍然作为支撑、阻力和价格磁铁发挥作用。


该指标为cTrader带来了完整的专业固定区间成交量剖面:在图表上选择任意区间,即可即时查看其成交量结构、控制点和价值区间。


🆕 版本2新增功能


• 交互式区间选择——将指标拖放到图表上,简单拖动两条线即可设置区间。无需输入,无需日期,无需设置。

• 分钟级数据精度——即使在H1或日线图上,剖面也由M1柱构建,提供比基于柱的近似更准确的成交量分布。

• 行业标准价值区——VAH和VAL现采用经典市场剖面扩展方法计算,使您的水平与专业平台一致。

• 买卖分割柱状图——每行显示买卖成交量比例,让您一目了然地发现吸收和不平衡。

• 平滑、即时渲染——剖面实时跟随您的滚动和缩放,无闪烁,无需等待下一笔成交。

• 可调节平滑度——细化剖面形状而不扭曲关键水平。

• 发展中的控制点——可选线显示控制点如何在区间内迁移。

• 更智能的数据处理——当区间需要时自动加载更早的历史数据,且若数据不完整会提醒您。

• 主题感知设计——颜色选择确保在深色和浅色图表上均清晰可读,且配有干净的信息面板显示区间、总成交量、控制点、VAH和VAL。


📊 显示内容


• 控制点(POC)——区间内成交量最高的价格水平。

• 价值区(VAH / VAL)——包含70%总成交量的区域(可调节范围50%至95%)。

• 成交量柱状图——10至400个价格行,按买卖主导或每行分割着色。

• 发展中的控制点——显示最合理价格如何在区间内演变(可选)。


🎯 交易者如何使用


• POC处的交易反应——它常作为强支撑/阻力和均值回归磁铁。

• 利用价值区边界定义区间范围,识别真实突破。

• 识别低成交量区域,价格往往快速移动——自然目标和止损区。

• 用实际市场参与确认关键水平,而非仅凭价格行为。


⚙️ 完全可调节


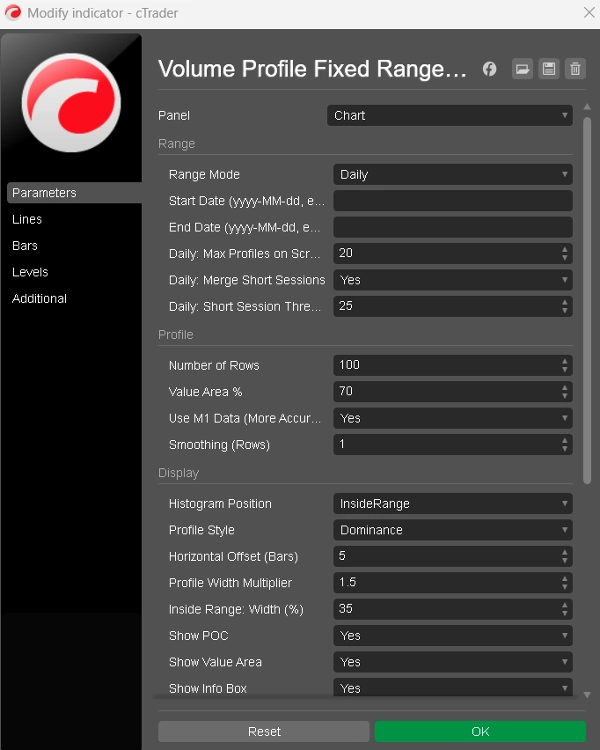
• 两种区间模式:交互式拖动线或固定起止日期。

• 行数、价值区百分比、平滑度、柱状图侧边、宽度和偏移。

• 两种柱状图样式:买卖分割或单一主导色。

• 每种颜色均可自定义;控制点、价值区、信息面板和发展中的控制点均可切换显示。


🔧 为日常使用打造


• 适用于任何品种和任何时间框架。

• 合理默认设置——附加后几秒内显示可用剖面。

• 轻量高效:仅在区间变化时重新计算,而非每笔成交。

• 一次购买,无需订阅,免费更新。


如果成交量分析是您交易流程的一部分——或者您希望它成为——这款工具为您提供了完整的固定区间工具集,原生支持cTrader。


摘要

AI 摘要
Volume Profile Fixed Range - Pro is a professional volume profile indicator designed for the cTrader platform. It visualizes the distribution of traded volume within a user-defined price range, highlighting key market levels such as the Point of Control (POC)—the price with the highest traded volume—and the Value Area, which contains the majority of volume (typically 70%, adjustable between 50% and 95%). The indicator uses minute-level data for precise volume calculations, even on higher timeframe charts.
Users can interactively select the range by dragging lines on the chart or specify fixed start and end dates. The volume histogram displays buy and sell volume splits per price level, enabling identification of buying/selling pressure and volume imbalances. Additional features include a developing POC line showing how the fair price evolved within the range, adjustable smoothing for profile shape refinement, and a theme-aware design for readability on different chart backgrounds.
The indicator supports full customization of rows, histogram style, colors, and display elements. It automatically loads historical data as needed and recalculates only when the selected range changes, optimizing performance. It is suitable for any symbol and timeframe, providing traders with volume-based support and resistance levels, breakout zones, and areas of low volume that may indicate rapid price movement.
指标配置
指标分类
交易量
输出类型
可视化
数据要求
仅 K 线
交易量
跳动点数据
支持的信号
波动性
趋势强度

客户评价

4.3
评价:3
5
67 %
4
0 %
3
33 %
2
0 %
1
0 %
客户评价
November 10, 2025
Solid option with care for volume based context. it adds useful information behind the price move, especially when used for checking participation, value areas and pressure. Volume context is stronger when POC, VWAP and value area agree across 2 sessions. The data helps most when price action confirms the same zone.
November 9, 2025
November 9, 2025
Helpful if controlled for a more controlled workflow. It helps with checking participation, value areas and pressure, but volume alone can be noisy without price action. Volume context is stronger when POC, VWAP and value area agree across 2 sessions. I would still keep manual review in the process.

讨论

常见问答

XAUUSD
cTrader Store 提供的所有产品,包括交易机器人、指标和插件,均由第三方开发者提供,仅供信息参考和技术访问之用。cTrader Store 并非经纪商,不提供投资建议、个人推荐或任何未来业绩保证。

该作者的其他作品

指标
Volume
Imbalance
+2
FOOTPRINT PRO - Candles tell you where price moved

猜您喜欢

"VA Footprint" 标识
评分最高
4.5
(4)
$35
/
$40
指标
SMC
Prop
+5
VA Footprint replaces your chart with a order flow one, the most precise way to read the market.
指标
Forex
Crypto
+4
Spot powerful 3-candle reversal patterns like Morning/Evening Star and Soldiers/Crows at key swing highs and lows
指标
BOS
Key Levels
+2
Maps bullish and bearish order block zones, CE levels and structure-based price action context.
指标
SMC
Forex
+5
Pinpoint FVGs, track fills and see mitigation stats — trade imbalances with clarity and confidence.
指标
ATR
Forex
+9
Auto-detect swing highs/lows. Spot reversals, map structure, and filter noise with adjustable strength.
指标
Key Levels
Liquidity Grab
+3
Visual market context dashboard showing bias states, CE positioning, session status and sweep context.
指标
Forex
Flexible Volume Profile, designed with performance in mind.
指标
AI-assisted
Order Block
+5
The daily bias estimator indicator uses ICT concepts to show whether the chart is bullish or bearish on multi-time frame
指标
BOS
MSS
+3
Orderblocks with Multi-Timeframe.
指标
Advanced price action tool that combines multiple technical analysis concepts
指标
Prop
Forex
+4
Displays real-time balance, equity, P&L, margin metrics directly on your charts.
指标
Forex
Crypto
Bar Close Alert Manager provides real-time alerts for bar closures with customizable notifications and automation.
指标
VWAP
Volume
+2
VWAP Stdev Heatmap: Advanced daily VWAP with 5-tier standard deviation bands and dynamic candlestick coloring.
指标
EMA
RSI
+2
Advanced TDI indicator with Shark Fin signals, chart arrows, MTF RSI, divergence detection and smart alerts.
指标
Plot higher-timeframe Bollinger Bands for clearer structure, pullback zones, and breakout signals—without switching char
指标
Moving Average
An Indicator made for scalping. Shows you the Sniper movement on Chart with the colour signals.
指标
ATR
RSI
+7
Identify bullish and bearish Order Blocks to spot key support/resistance levels and potential trend reversals! 📈🔄
指标
SMC
Forex
+5
Pure Price Action ICT Tools

价格

注册日期 09/04/2025
14
销售

















