
说明
介绍 真实强度指数(TSI) 指标,这是一种强大的工具,旨在通过提供对市场动量和趋势强度的清晰洞察来增强您的交易策略。
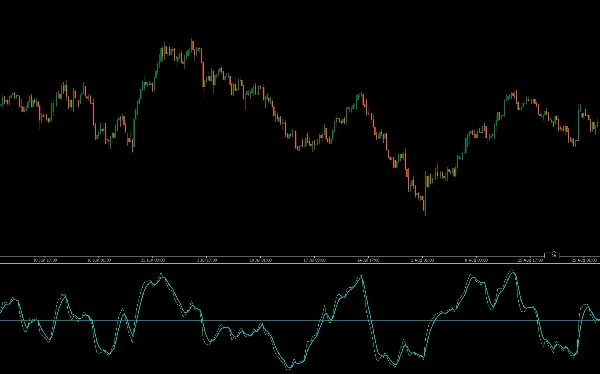
TSI 指标衡量价格运动的潜在强度,平滑市场噪音,为您提供更准确的趋势方向图景。通过突出超买和超卖状况,TSI 帮助您识别潜在的反转点并确认趋势延续。
TSI 使用金融工具潜在动量的移动平均。动量被视为价格运动的领先指标,而移动平均通常滞后于价格。TSI 结合了这些特性,创造出比单独的动量或移动平均更能同步市场转折的价格和方向指示。
TSI 指标非常适合寻求完善分析和改进决策的交易者,提供了一种可靠且直观的方式来衡量市场动态。使用真实强度指数升级您的交易工具包,实现卓越的交易表现。
- 趋势识别:正值 TSI 表示看涨趋势,负值 TSI 表示看跌趋势。
- 动量强度:衡量趋势的运动强度,数值越高表示动量越强。
- 潜在反转信号:
-
- 交叉点:接近零线的信号线交叉可能预示潜在的进出场点。
- 背离:当价格创出新高或新低,而 TSI 未能跟随时,可能预示趋势反转。
- 超买/超卖状况:它可以帮助识别资产是否可能处于超买或超卖状态,尽管具体的超买和超卖水平可能因资产的波动性而异。
摘要
指标配置
客户评价
4.0
评价:1
5 | 0 % | |
4 | 100 % | |
3 | 0 % | |
2 | 0 % | |
1 | 0 % |
客户评价
November 22, 2025
The setup improves when the opening read should not drive the whole decision, and 3 percent DD is the line to watch.
讨论
常见问答
BTCUSD
Forex
Signal
Indices
EURUSD
Commodities
GBPUSD
NZDUSD
Prop
Crypto
Stocks
XAUUSD
NAS100
USDJPY
cTrader Store 提供的所有产品,包括交易机器人、指标和插件,均由第三方开发者提供,仅供信息参考和技术访问之用。cTrader Store 并非经纪商,不提供投资建议、个人推荐或任何未来业绩保证。


!["High-Low Divergence [Iridio Capital]" 标识](https://cdn.ctrader.com/image/webp/443c4661-7abb-40f1-842f-4b6ec560649b_40914)


价格
注册日期 25/09/2025
25
销售
315
免费安装