
Support & Resistance Pro
指标
53 购买
版本 3.0, Jul 2026
Windows 版、Mac 版
5.0
评价:1
说明
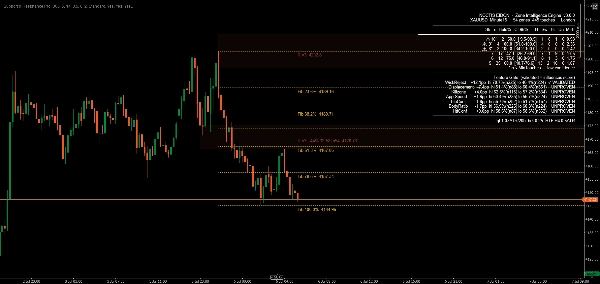
Support & Resistance Pro 识别支撑和阻力区域,并且——与大多数支撑/阻力工具不同——通过一个基于真实历史数据而非假设的独立统计引擎,衡量这些区域是否真正有效。每个区域都会显示一个保持率统计数据及其置信区间,该数据是从完整的历史区域群体计算得出,包括后来被突破并从图表中消失的区域。该类别中的大多数指标只计算今天仍可见的水平,这会悄悄地夸大每一个强度声明。而这个工具不会。
主要特点
- 统计验证的区域 每个区域都带有真实的、历史测量的保持率及95%的置信区间——而非假设的强度评分。一个信号——触点处的影线拒绝——已被正式验证:在EURUSD和比特币上确认,跨多个时间框架,包括一个真正的样本外测试,在未见数据上依然保持强度。
- 自动角色转换 被突破的支撑自动变为阻力,反之亦然,并带有明显的视觉标记——指标跟踪区域位于价格的哪一侧,并相应着色,而不是固定颜色于区域最初形成的方式。
- 更高时间框架的汇聚 图表上的区域会与您选择的更高时间框架进行核对,匹配的HTF结构直接绘制在图表上,作为独立的视觉叠加层。
- 斐波那契回撤集成 自动绘制最近波动的斐波那契回撤水平,每个水平都标注了比例和您经纪商本地精度的精确价格,自动与附近区域错开,避免标签重叠。
- 饱和度警告 被测试次数过多的区域会被标记,而非假设更强——我们的数据表明,经过大量测试的区域表现 更差,可能是因为其休眠流动性已经被耗尽。
- 开放验证门槛 六个额外的候选信号——实体比例、接近速度、交易时段/杀区时机和位移测试——在内置统计面板上实时显示,并带有各自的保持率读数。它们不会影响任何评分或排名,直到各自独立通过了与影线拒绝相同的证据门槛。您可以准确看到什么已被证明,什么尚未。
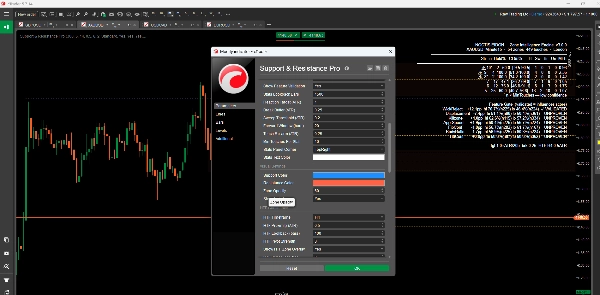
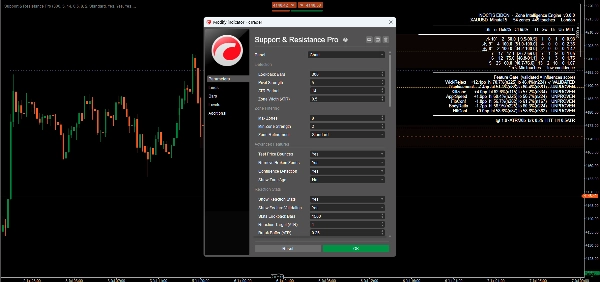
- 可定制设置 在检测灵敏度、区域过滤、视觉样式和警报行为方面提供广泛的参数控制。
- 实时警报 可配置的弹出、电子邮件和声音警报,针对区域触及、突破和汇聚事件,每个通道可独立切换。
优势
- 证据胜于假设:图表上的每个统计数据都可以独立核查——指标包含自己的样本内/样本外验证工具
- 无幸存者偏差:强度声明基于完整的历史区域群体,而不仅仅是恰好存活的水平
- 诚实披露:已验证和未验证的信号始终在图表上标注清楚
适用对象
希望看到水平背后统计证据的交易者,而不仅仅是一条线——日内交易者、波段交易者以及系统化交易者,涵盖外汇、加密货币及其他工具,寻求对支撑和阻力进行严格测量的方法。
结论
Support & Resistance Pro 建立在一个原则之上:强度声明只有经过测量才是真实的。一个信号已经通过了跨品种、跨时间框架及样本外确认的门槛。其余信号则诚实地显示仍在测试中——因为一个你无法验证的数字根本不值得展示。
摘要
AI 摘要
Support & Resistance Pro is an advanced trading indicator designed to identify critical support and resistance levels in financial markets. It uses advanced algorithms and historical price data to enhance technical analysis and support informed trading decisions. Key features include:
- Dynamic support and resistance levels that adjust in real-time based on recent price action.
- Multi-timeframe analysis to view levels across different timeframes for a comprehensive market overview.
- Calculation and display of pivot points to mark potential intraday reversal zones and target prices.
- Highlighting of psychological price levels (round numbers) to gauge market sentiment.
- Integration of Fibonacci retracement levels to assist in identifying support and resistance during price corrections.
- Customizable settings for lookback periods, visualization styles, and color schemes to suit individual trading preferences.
- Clear graphical representation for easy identification of market conditions.
- Configurable real-time alerts when prices approach critical levels.
This indicator supports various trading styles including scalping, day trading, and swing trading, and is suitable for traders in forex, commodities, stocks, and indices markets. It is intended for both beginner and experienced traders seeking structured market analysis and enhanced decision-making through reliable support and resistance data.
指标配置
指标分类
支撑与阻力
输出类型
可视化
信号
数据要求
仅 K 线
支持的信号
突破
反转
触及水平位
突破水平位
客户评价
5.0
评价:1
5 | 100 % | |
4 | 0 % | |
3 | 0 % | |
2 | 0 % | |
1 | 0 % |
客户评价
November 8, 2025
A clean, reliable S/R mapper ⚡. Support & Resistance Pro marks key zones with clarity and speed - perfect for Price Action fans who need structure, not clutter. No alerts or price labels yet, but for spotting reaction levels and planning entries, it’s a solid chart companion.
讨论
常见问答
Fibonacci
Forex
Breakout
Scalping
GBPUSD
cTrader Store 提供的所有产品,包括交易机器人、指标和插件,均由第三方开发者提供,仅供信息参考和技术访问之用。cTrader Store 并非经纪商,不提供投资建议、个人推荐或任何未来业绩保证。


价格
注册日期 22/11/2024
133
销售
2.57K
免费安装