MARCs_MARKET_OVERVIEW_PRO
指标
版本 1.0, Aug 2026
Windows 版、Mac 版
Trading product for MARCs_MARKET_OVERVIEW_PRO 指标 Key Levels RSI, image 2
Trading product for MARCs_MARKET_OVERVIEW_PRO 指标 Key Levels RSI, image 3
Trading product for MARCs_MARKET_OVERVIEW_PRO 指标 Key Levels RSI, image 4
Trading product for MARCs_MARKET_OVERVIEW_PRO 指标 Key Levels RSI, image 5
Trading product for MARCs_MARKET_OVERVIEW_PRO 指标 Key Levels RSI, image 6
Trading product for MARCs_MARKET_OVERVIEW_PRO 指标 Key Levels RSI, image 7
Trading product for MARCs_MARKET_OVERVIEW_PRO 指标 Key Levels RSI, image 8
Trading product for MARCs_MARKET_OVERVIEW_PRO 指标 Key Levels RSI, image 9
Trading product for MARCs_MARKET_OVERVIEW_PRO 指标 Key Levels RSI, image 10
注册日期 24/06/2026
1
免费安装

说明

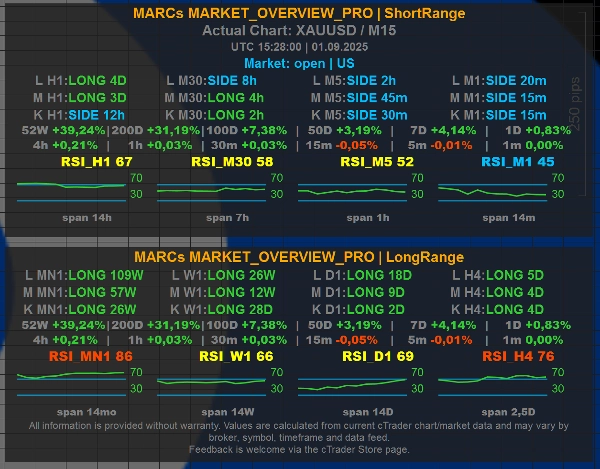
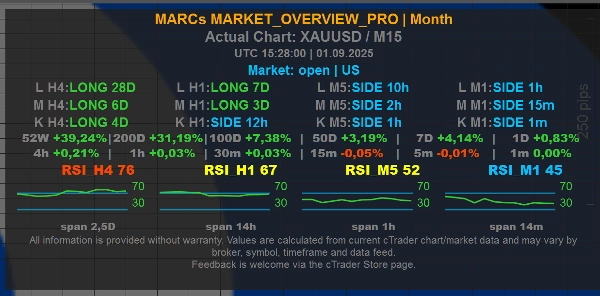
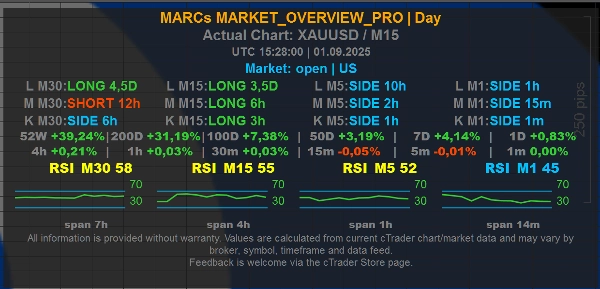
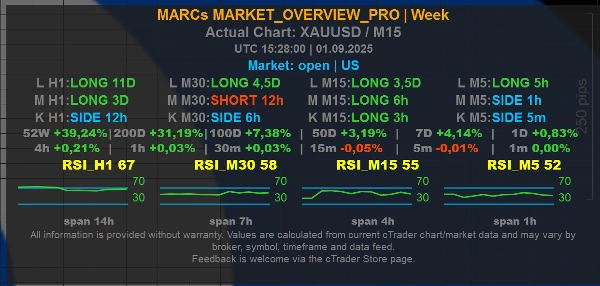
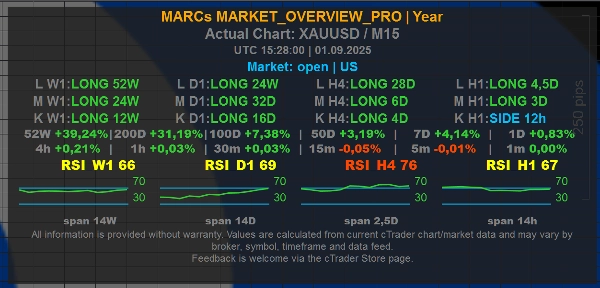
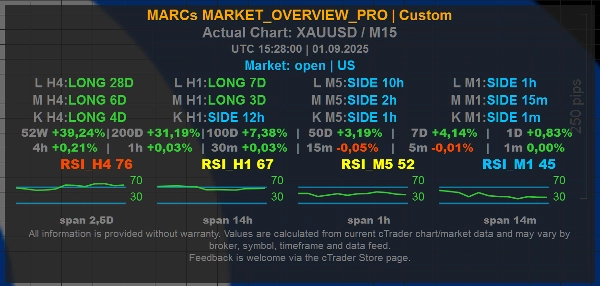
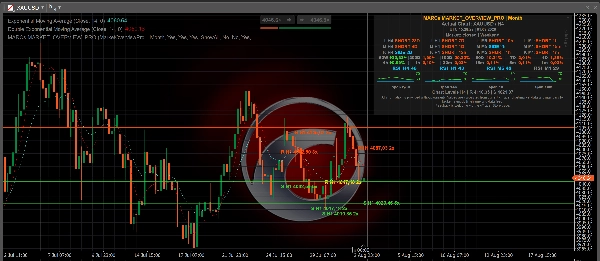
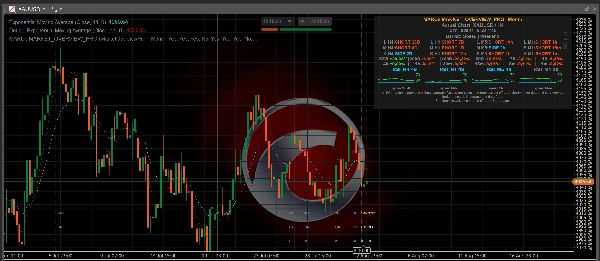
MARCs MARKET_OVERVIEW_Pro is a multi-timeframe market overview indicator for cTrader.


It displays a compact on-chart dashboard with trend context, RSI readings, market/session information and configurable time-horizon presets. The indicator was originally developed around XAUUSD / Gold analysis, but is designed to work as a general market overview tool on any available chart symbol, depending on broker data quality and available market history.


Main features:

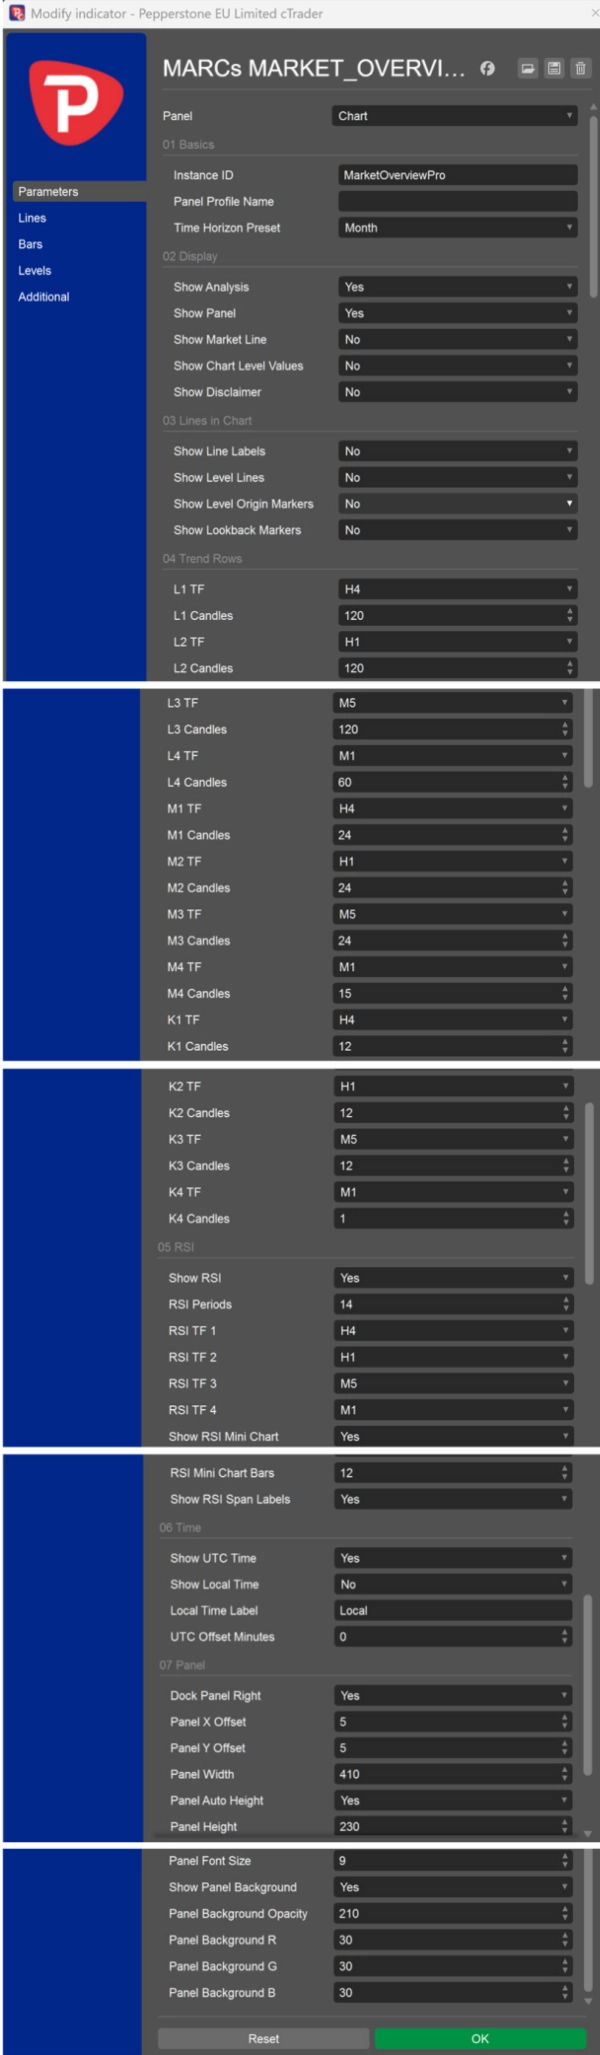
- Multi-timeframe trend rows for short, medium and long market context

- Configurable Day, Week, Month, Year, ShortRange, LongRange and Custom presets

- RSI values and mini RSI charts across selected timeframes

- Optional UTC and local time display

- Optional market/session line

- Optional chart-level reference lines

- Optional chart-level values shown directly in the panel


Level Lines and Chart Level Values:

The optional Show Level Lines setting can display calculated chart reference levels from one selected timeframe: M1, M5, M15, M30, H1, H4, D1, W1 or MN1. For these individual timeframe selections, the indicator shows the nearest calculated resistance above the current price and the nearest calculated support below the current price. ShowAll displays the broader H1 level set from the existing H1 level calculation. No keeps level lines hidden.


The optional Show Chart Level Values setting can show the same nearest resistance/support reference values directly in the panel without drawing lines on the chart. The panel line is labelled, for example, "Chart Levels H1 | R ... | S ..." to make clear that the values refer to chart-level references.


How Level Lines are calculated:

The levels are derived from past swing highs and swing lows in the selected timeframe. Nearby swing points are grouped into level clusters, and only areas with enough repeated touches are shown. This makes the lines visual market-context markers based on available chart history.


Important:

MARCs Market Overview Pro is an analysis-only market overview tool. It does not place trades, manage positions, provide investment advice or guarantee trading results.


Level Lines are not buy signals, sell signals, stop-loss recommendations, take-profit recommendations or investment advice. They do not predict that price will reverse, break out or react at a specific level.


All readings depend on the available cTrader chart data, broker symbol feed, timeframe and market history. Values may differ between brokers, symbols and data feeds.


Trading involves risk. Past performance does not guarantee future results.

摘要

AI 摘要
MARCs MARKET_OVERVIEW_Pro is a multi-timeframe market overview indicator designed for the cTrader platform. It provides a compact on-chart dashboard that displays trend context across short, medium, and long timeframes, RSI values with mini RSI charts, and market/session information. Users can configure time-horizon presets including Day, Week, Month, Year, ShortRange, LongRange, and Custom settings.
The indicator supports optional display of UTC and local times, market/session lines, and chart-level reference lines. These reference lines represent calculated support and resistance levels derived from clusters of past swing highs and lows on selected timeframes ranging from 1 minute to monthly intervals. Users can choose to show these levels as lines on the chart or as numeric values within the dashboard panel.
Originally developed with a focus on XAUUSD (Gold), MARCs MARKET_OVERVIEW_Pro is adaptable to any chart symbol supported by the broker’s data feed and market history. It serves as an analysis tool providing visual market structure and momentum insights but does not execute trades or offer trading advice. The indicator’s readings depend on the quality and availability of broker data and chart history.
指标配置
指标分类
市场结构(SMC)
输出类型
可视化
过滤器
数据要求
仅 K 线
支持的信号
趋势强度
触及水平位

客户评价

0.0
评价:0
客户评价
该产品尚无评价。已经试过了?抢先告诉其他人!

讨论

常见问答

Key Levels
RSI
Market Structure
Risk Dashboard
Support & Resistance
cTrader Store 提供的所有产品,包括交易机器人、指标和插件,均由第三方开发者提供,仅供信息参考和技术访问之用。cTrader Store 并非经纪商,不提供投资建议、个人推荐或任何未来业绩保证。

该作者的其他作品

指标
RSI
Key Levels
+3
MARKs Free XAUUSD market overview dashboard with trend rows, RSI context, sessions and fixed Day/Month presets.
cBot
Conservative
Fixed Risk %
+5
MARCs GOLD H4-Gold-Swing-Bot for XAUUSD with transparent long-term backtests and optional reserve/guard system.
3.01
盈利系数

猜您喜欢

指标
Prop
Forex
+10
Heatmap Pro analiza la volatilidad, el volumen y la acción del precio para "pintar" tu gráfico con zonas de color.
指标
AI-assisted
Order Block
+5
The daily bias estimator indicator uses ICT concepts to show whether the chart is bullish or bearish on multi-time frame
指标
Forex
BTCUSD
+10
Trend-following channel using dual MAs with visual cloud and optional alerts on crossovers
指标
AI
ATR
+26
MacD Custom Indicator-Multiple Time Frame
指标
ATR
Key Levels
+5
CPR indicator that actually predicts the day ahead: width percentile scoring for breakout-day detection
指标
Prop
Forex
+13
Identifies market compression zones and explosive Breakout moments using mathematical modeling.
指标
RSI
Signal
+2
Dynamic circles visualize price's volatility position. Like RSI for market overextension & stretch. Quantify context.
指标
ATR
RSI
+3
🚀 Specialized algorithm is designed to confirm entry and exit points with precision 🎯
指标
Forex
BTCUSD
+5
Simple ICT Concepts
指标
AI
SMC
+19
ZigZag Pro — Advanced swing detection with ATR threshold, fractal confirmation, and colored segments. Clean market
指标
Volume
Key Levels
+1
Order book indicator .Don't trade against the flow. Trade with the truth!
指标
Drawdown Monitor
Proprietary trading desk risk monitoring dashboard!
指标
RSI
Breakout
+1
"Identify key market zones and visualize support/resistance from multiple timeframes on a single chart.
指标
BOS
CHOCH
+5
A professional-grade cTrader indicator for traders following the Inner Circle Trader (ICT) methodology. It replaces 6–8
指标
ATR
Forex
+11
Trend-following indicator with dynamic ATR-based trailing stop for precise entry/exit signals
指标
Prop
Forex
+10
IBS Indicator – Measures price position within bars for smarter trades. Works on all markets & timeframes.
指标
ATR
Forex
+3
LevelMaster S/R: Pinpoint key support & resistance zones with precision. Perfect for traders of all levels Trade smarter
指标
SMC
Forex
+7
Simple Smart Money Concepts (SMC)

价格

注册日期 24/06/2026
1
免费安装