MARCs_MARKET_OVERVIEW_LITE_XAUUSD
指标
1 下载
版本 1.0, Aug 2026
Windows 版、Mac 版
Trading product for MARCs_MARKET_OVERVIEW_LITE_XAUUSD 指标 Key Levels RSI, image 2
Trading product for MARCs_MARKET_OVERVIEW_LITE_XAUUSD 指标 Key Levels RSI, image 3
Trading product for MARCs_MARKET_OVERVIEW_LITE_XAUUSD 指标 Key Levels RSI, image 4
Trading product for MARCs_MARKET_OVERVIEW_LITE_XAUUSD 指标 Key Levels RSI, image 5
注册日期 24/06/2026
1
免费安装

说明

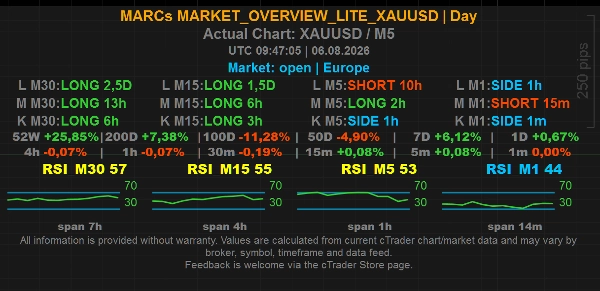
MARCs Market Overview Lite XAUUSD is a free, reduced-scope market overview indicator for cTrader.


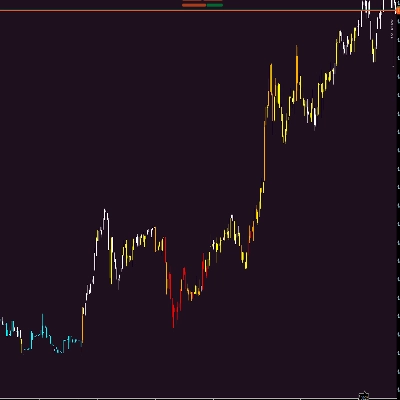
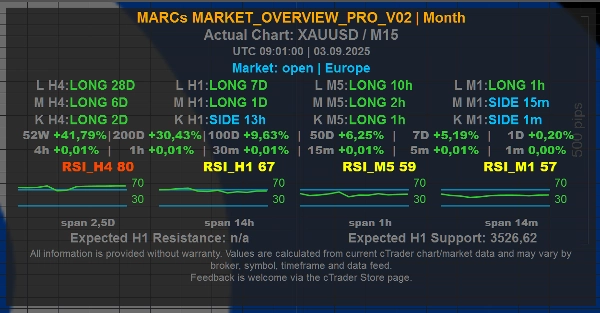
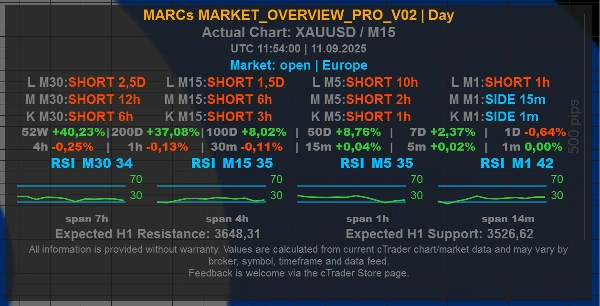
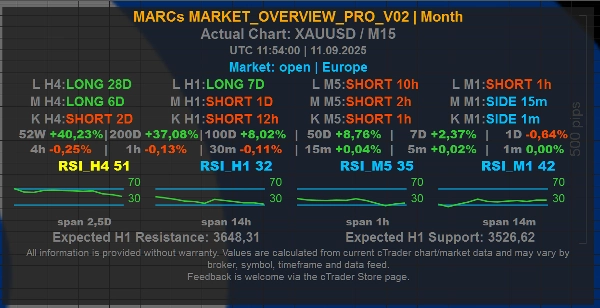
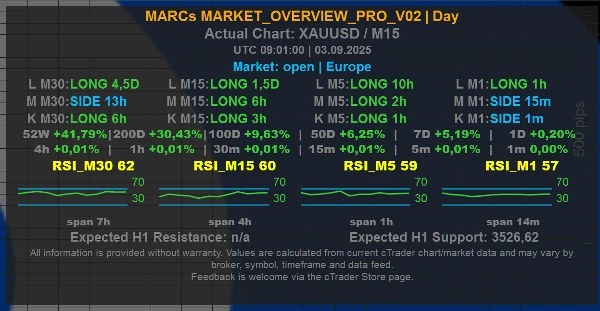
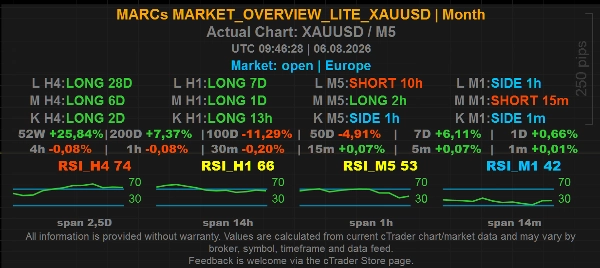
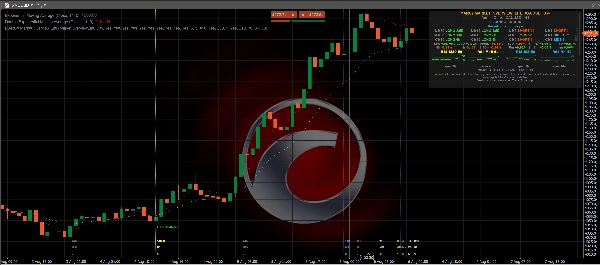
It displays a compact on-chart dashboard for XAUUSD / Gold charts with multi-timeframe trend context, RSI readings, market/session information, optional chart-level values and a simplified set of display controls.


This Lite edition is designed as a focused XAUUSD overview tool. It keeps the core panel workflow of MARCs Market Overview while using fixed internal settings and a limited preset selection.


Main features:

- Free Lite edition for XAUUSD charts

- Compact on-chart market overview panel

- Multi-timeframe trend rows for short, medium and long market context

- RSI values and mini RSI history across fixed internal timeframes

- Market/session line with UTC time

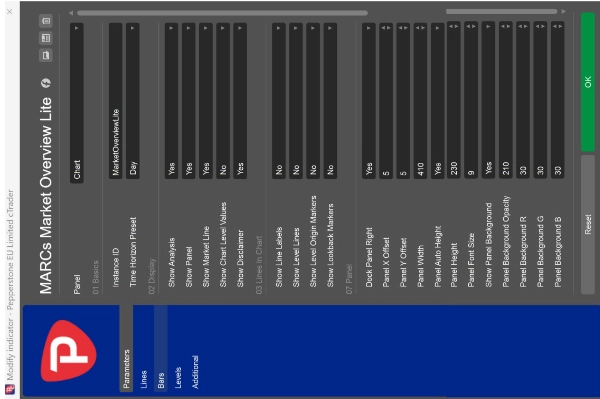
- Day and Month time-horizon presets

- Optional market line

- Optional H1 chart-level values shown directly in the panel

- Optional simplified H1 level lines on the chart

- Optional line labels, level origin markers and lookback markers

- Fully adjustable panel position, width, height, font size and background appearance


Lite edition limitations:

- Works on XAUUSD charts only

- Time Horizon Preset is limited to Day and Month

- Trend rows use fixed internal timeframe and candle settings

- RSI display uses fixed internal settings

- Time display uses fixed internal settings

- Chart level values are limited to H1

- Chart level lines are available as a simplified on/off option and use fixed H1 levels

- Some advanced customisation options from the Pro version are not included


If the indicator is attached to another symbol, the panel shows a clear XAUUSD-only notice instead of displaying overview values.


Level Lines and Chart Level Values:

The optional Show Level Lines setting can display calculated H1 chart reference levels. In the Lite edition, this is simplified to an on/off option. When enabled, the indicator shows the nearest calculated resistance above the current price and the nearest calculated support below the current price.


The optional Show Chart Level Values setting can show the same nearest H1 resistance/support reference values directly in the panel without drawing lines on the chart. The panel line is labelled, for example, "Chart Levels H1 | R ... | S ..." to make clear that the values refer to chart-level references.


How Level Lines are calculated:

The levels are derived from past swing highs and swing lows in the selected internal timeframe. Nearby swing points are grouped into level clusters, and only areas with enough repeated touches are shown. This makes the lines visual market-context markers based on available chart history.


What Level Lines do not mean:

Level Lines are not buy signals, sell signals, stop-loss recommendations, take-profit recommendations or investment advice. They do not predict that price will reverse, break out or react at a specific level.


About the Pro version:

MARCs Market Overview Pro offers broader symbol use, more time-horizon presets and more detailed customisation options. The Lite XAUUSD edition is a free, focused version for traders who want a simpler Gold/XAUUSD market overview panel.


Important:

MARCs Market Overview Lite XAUUSD is an analysis-only market overview tool. It does not place trades, manage positions, provide investment advice or guarantee trading results.


All readings depend on the available cTrader chart data, broker symbol feed, timeframe and market history. Values may differ between brokers, symbols and data feeds.


Trading involves risk. Past performance does not guarantee future results.


摘要

AI 摘要
MARCs Market Overview Lite XAUUSD is a market overview indicator designed for cTrader, focused exclusively on XAUUSD (Gold) charts. It provides a compact on-chart dashboard displaying multi-timeframe trend context (short, medium, long), RSI values with mini history, and market/session information with UTC time. The indicator includes fixed Day and Month time-horizon presets and offers optional features such as market lines, H1 chart-level values, simplified H1 level lines, line labels, and level origin markers.
Level lines are calculated from past swing highs and lows on the H1 timeframe, highlighting key resistance and support clusters based on repeated price touches. These lines serve as visual market context markers but do not constitute trading signals or advice.
The panel’s position, size, font, and background appearance are fully adjustable. The Lite edition uses fixed internal settings and limited presets, restricting its use to XAUUSD charts only. It does not place trades or provide investment recommendations. This tool relies on available chart data and broker feeds, which may vary.
This edition offers a streamlined overview for Gold traders, with broader symbol support and customization available in the Pro version.
指标配置
指标分类
市场结构(SMC)
输出类型
可视化
过滤器
数据要求
仅 K 线
支持的信号
趋势强度
触及水平位

客户评价

0.0
评价:0
客户评价
该产品尚无评价。已经试过了?抢先告诉其他人!

讨论

常见问答

Key Levels
RSI
Market Structure
Risk Dashboard
Support & Resistance
cTrader Store 提供的所有产品,包括交易机器人、指标和插件,均由第三方开发者提供,仅供信息参考和技术访问之用。cTrader Store 并非经纪商,不提供投资建议、个人推荐或任何未来业绩保证。

该作者的其他作品

cBot
Conservative
Fixed Risk %
+5
MARCs GOLD H4-Gold-Swing-Bot for XAUUSD with transparent long-term backtests and optional reserve/guard system.
3.01
盈利系数
指标
RSI
Key Levels
+3
MARCs Multi-timeframe market dashboard with trend rows, RSI context, sessions, presets and optional chart levels.

猜您喜欢

指标
Prop
VWAP
+12
FBX VWAP Anchored — Professional VWAP
指标
VWAP
Volume
+2
VWAP Stdev Heatmap: Advanced daily VWAP with 5-tier standard deviation bands and dynamic candlestick coloring.
指标
Key Levels
Supply & Demand
+1
Smart Entry Zone indicator with Case A/B/C signals, automatic TP/SL tracking, and trade statistics for US500.
指标
RSI
Breakout
+1
"Identify key market zones and visualize support/resistance from multiple timeframes on a single chart.
指标
BOS
MSS
+5
WinSMC is an overlay SMC indicator for cTrader. It helps you visually identify!
指标
VWAP
Volume for Renko/Range
指标
BOS
Imbalance
+4
Automatically detects and highlights both Bullish and Bearish Fair Value Gaps (FVGs).
指标
ATR
RSI
+11
This indicator puts three helpful trading tools on your chart at once. Think of it like having three expert traders
指标
ATR
RSI
+1
AI Supertrend MTF uses K-NN Machine Learning to eliminate lag. Features multi-timeframe projection & dynamic glowing clo
指标
EMA
Supertrend
+5
Pro Trend Engine: Multi-timeframe EMA crosses, pullback rejections, trend cloud & live radar dashboard.
指标
Triangle
Double Top
+5
Know which liquidity sweeps are real. Auto-tracks EQH/EQL and confirms genuine reversals, not just broken levels.
指标
Forex
BTCUSD
+4
🚀 HALF TREND Indicator - The Ultimate Trend Following System 🚀
指标
ATR
RSI
+16
Highlight market consolidation zones instantly with this Inside Candle indicator — precise, clean, and powerful.
指标
EMA
SMA
+2
Smart volume analysis with BP detection, trend confirmation and breakout signals for professional traders.
指标
AI-assisted
Order Block
+5
The daily bias estimator indicator uses ICT concepts to show whether the chart is bullish or bearish on multi-time frame
指标
Supply & Demand
Support & Resistance
RAF Supply Demand Lite v1.0 automatically detects clean Supply and Demand zones using confirmed swing highs and lows. Zo
指标
Boost your trading with Candlestick Patterns for cTrader – auto-detect key signals for smarter, faster decisions!
指标
RSI
Key Levels
+1
High-precision TDI indicator with Shark Fin & Extreme Cross signals for spotting rapid market reversals.

价格

注册日期 24/06/2026
1
免费安装