
说明
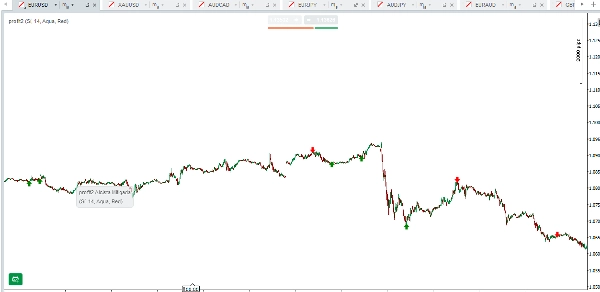
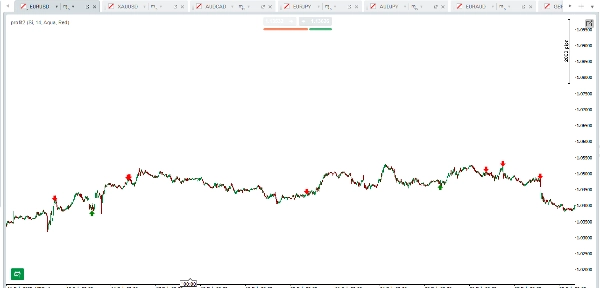
用Phoenix Zones革新你的交易,这是一款高级指标,能够精准检测市场在虚假波动后转向的确切时刻。专为寻求高概率入场的交易者设计,Phoenix Zones自动识别那些价格试图突破支撑或阻力但失败,随后强力反转的罕见时刻。
Phoenix Zones为你提供:
✅ 关键反转点自动检测,显示市场大户的真实意图
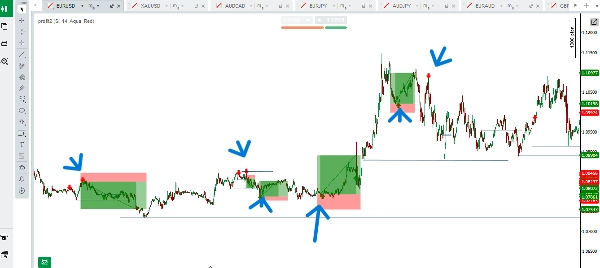
✅ 清晰的视觉区域,保留在你的图表上,展示未来入场和风险管理的关注区域
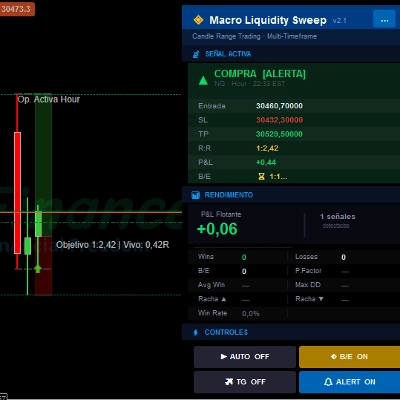
✅ 可定制的提醒,当出现新的交易机会时即时通知你
✅ 智能缓解系统,识别区域何时被无效,保持你的图表清晰且相关
专业交易者知道,最佳机会出现在大多数人判断错误的时候。Phoenix Zones准确揭示市场在向大众欺骗后展现真实方向的时刻。
不要再错过高收益的机会。Phoenix Zones将这些虚假突破转化为清晰精准的信号,让你在新手亏损退出时自信入场。
摘要
AI 摘要
Phoenix Zones is a trading indicator designed to identify critical market reversal points following deceptive price moves. It automatically detects rare moments when price attempts to break support or resistance levels but fails and then reverses sharply. The indicator provides clear visual zones on the chart that highlight areas of interest for potential entries and risk management. It includes customizable alerts to notify traders instantly of new trading opportunities. Additionally, Phoenix Zones features an intelligent mitigation system that recognizes when a reversal zone is invalidated, helping maintain a clean and relevant chart. This tool supports multiple markets including Forex, stocks, indices, commodities, and cryptocurrencies, and is suitable for strategies such as breakout and scalping. It aims to assist traders in identifying high-probability entry points by revealing moments when the market misleads the majority before moving decisively in the opposite direction.
指标配置
客户评价
5.0
评价:2
5 | 100 % | |
4 | 0 % | |
3 | 0 % | |
2 | 0 % | |
1 | 0 % |
客户评价
April 29, 2025
The main upside is the opening read should not drive the only input. Manual context is still required.
April 29, 2025
The workspace is easier to scan, but it should stay in the support stack.
讨论
常见问答
Prop
Forex
Signal
Breakout
Scalping
Indices
Commodities
Crypto
Stocks
AI
XAUUSD
cTrader Store 提供的所有产品,包括交易机器人、指标和插件,均由第三方开发者提供,仅供信息参考和技术访问之用。cTrader Store 并非经纪商,不提供投资建议、个人推荐或任何未来业绩保证。
该作者的其他作品


价格
25
销售
390
免费安装