
说明
鲸鱼流动性与吸收概况
跟踪机构资金,分析订单流,并以体积精度识别反转区域
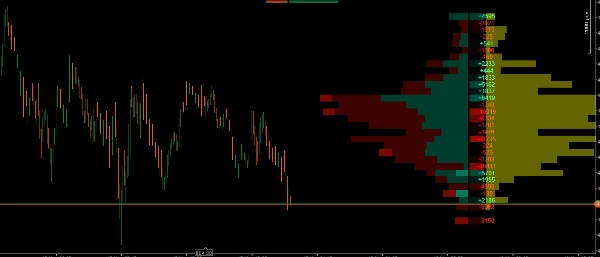
鲸鱼流动性与吸收概况 并非传统的成交量概况。它是一套市场微观结构分析工具,细分每笔交易,不仅向您展示 成交量 发生的位置,还展示了 谁 进行了交易(机构与散户),以及 价格如何 在这些水平上互动(进攻与吸收)。
它配备了优化的渲染引擎,将所有数据投射到当前价格的右侧,保持您的图表完全清晰且无延迟。
主要功能
- 强度过滤器(仅限鲸鱼): 使用百分位算法(例如,前97%)将机构(“强”)成交量与散户(“弱”)成交量区分开。您可以切换“仅强”模式,专门跟踪聪明资金的足迹。
- 堆叠成交量概况: 直观显示每个价格水平的多头和空头成交量分布,便于识别控制点(POC)和高/低成交量节点(HVN/LVN)。
- 自动价值区检测: 突出显示成交量最高百分比交易的价格水平(默认70%),使外围区域变暗,便于一目了然地读取市场背景。
- Delta 概况(热力图): 计算每个价格水平市场买入与卖出的精确差额。包括数值和视觉热力图,快速识别谁在积极控制市场。
- 吸收概况(黄色区域): 测量特定在蜡烛图影线内被困的成交量。这让您可以直观地看到聪明资金正被动吸收被困散户的流动性。
- 优化性能: 体积计算仅在最新蜡烛上处理,确保您的 cTrader 平台运行流畅高效,即使在较低时间框架下也是如此。
如何在交易中使用此指标?
此指标为您的交易提供三层确认。以下是如何有效组合它们:
1. 使用成交量概况与价值区定义背景
- 使用成交量概况识别价格接受度最高的位置(价值区和控制点)。
- 策略: 在价值区底部(支撑)寻找买入机会,在价值区顶部(阻力)寻找卖出机会。
2. 使用 Delta 概况评估进攻性
- 当价格达到关键水平(例如支撑区)时,查看 Delta 列。
- 策略: 如果您在支撑处寻找买入,您希望看到该水平有强烈正向(绿色)Delta,表明买家积极介入。如果 Delta 仍然严重为负,卖家仍占主导。
3. 使用吸收概况找到完美触发点(指标核心)
- 这正是该工具真正闪耀的地方。市场常常看似急剧下跌(强烈负向 Delta),但价格停止下跌。为什么?因为“鲸鱼”使用限价单 吸收 了所有卖压。
- 策略(反转交易): 如果您看到价格跌入关键水平且 Delta 为负(被困散户卖家),但突然在 吸收概况 中出现一根大黄条,意味着机构刚刚吸收了该影线内的所有流动性。这是您进入相反方向的最佳触发信号!
4. 使用“强度过滤器”过滤噪音
- 如果市场盘整且方向不明,开启 “仅强” 选项。这将隐藏所有无关的散户噪音,准确显示大型资金正在积累或分配其头寸的位置。
摘要
AI 摘要
Whale Liquidity & Absorption Profile is a market microstructure indicator designed for detailed volume and order flow analysis. It distinguishes institutional ("whale") volume from retail activity using a percentile-based Strength Filter, enabling users to focus on smart money footprints. The indicator visually presents a stacked volume profile that separates bullish and bearish volume by price level, highlighting key areas such as the Point of Control (POC) and High/Low Volume Nodes (HVN/LVN). It automatically detects the Value Area, where the majority of volume is concentrated, to provide clear market context.
A Delta Profile heatmap calculates the net difference between market buys and sells at each price level, showing buyer or seller aggression. The Absorption Profile identifies volume trapped in candlestick wicks, revealing where institutional traders absorb liquidity from retail participants. The indicator’s optimized engine processes heavy volumetric calculations only on the latest candle, ensuring smooth performance on the cTrader platform.
Traders can use this tool to define market context, evaluate buying or selling aggression, and pinpoint reversal triggers based on absorption patterns. The "Strong Only" mode filters out retail noise during consolidation phases, focusing on institutional accumulation or distribution zones. This indicator supports volume and DOM data visualization to enhance decision-making around key support and resistance levels.
指标配置
指标分类
交易量
输出类型
可视化
数据要求
交易量
市场深度
客户评价
5.0
评价:1
5 | 100 % | |
4 | 0 % | |
3 | 0 % | |
2 | 0 % | |
1 | 0 % |
客户评价
May 21, 2026
Thanks for this sir, the delta and volume are depicted cleanly and accurately on this indicator. With the addition of absortion and filter settings for volume, it beats most in its class.
讨论
常见问答
Key Levels
Volume
Support & Resistance
cTrader Store 提供的所有产品,包括交易机器人、指标和插件,均由第三方开发者提供,仅供信息参考和技术访问之用。cTrader Store 并非经纪商,不提供投资建议、个人推荐或任何未来业绩保证。


猜您喜欢


价格
25
销售
390
免费安装