说明
这不是你典型的成交量差异指标。这是Level 2 DOM成交量差异指标——适用于cTrader的机构级订单流。机构为此支付数百万的优势。
每个散户交易者面临的问题。一根蜡烛收盘为绿色。成交量很高。你买入。
价格立即反转。你被止损出场。图表“欺骗”了你。
它没有欺骗——你只是看不到蜡烛内部发生了什么。那根高成交量的绿色柱子?其中70%的成交量是激进的卖出。收盘价是由区间底部一层薄薄的买单支撑的。机构正在向你的买单分配。
标准成交量指标显示的是总量。它们从不显示 谁在控制。
成交量差异改变了这一点。成交量差异真正向你展示的内容
成交量差异将每根柱子的成交量分为 买入成交量 和 卖出成交量,然后计算差值——即 差异。正差异意味着买方更为激进。负差异意味着卖方占主导。
这是区分专业交易者和散户交易者的最重要信息:不是 交易了多少,而是 哪一方交易得更激进。这就是信念。差异是每根价格柱背后的意图指纹。
但这还不是全部
此指标不做猜测。它在专有的数据混合中读取 Level 2市场深度数据——即你屏幕上看到的价格背后的实际订单簿。
Level 2数据(也称为DOM——市场深度)显示了每个价格级别堆积的真实买卖订单。不是最后一笔交易。不是估算。是来自银行、对冲基金和机构交易台通过你的经纪商流动性提供者流动的实际静态流动性。
结果是在买卖成交量分类上的准确率达到 85-95%——远超任何基于公式的近似方法。
为什么这很重要——机构看到而你看不到的
高盛、Citadel、Jump Trading——他们都使用订单流数据交易。他们实时看到买卖压力。他们看到吸收。他们看到某个价位被守护。他们看到差异与价格的背离。
他们为此基础设施支付数百万。数据馈送、同址服务器、专有工具。
此指标将相同的核心概念带到你的cTrader图表中。不是简化版。是来自你经纪商流动性池的真实Level 2 DOM数据,处理成专业订单流交易者使用的买卖分类。
散户交易者和机构交易者的区别不是智力,而是信息。成交量差异弥合了这一差距。
适用人群
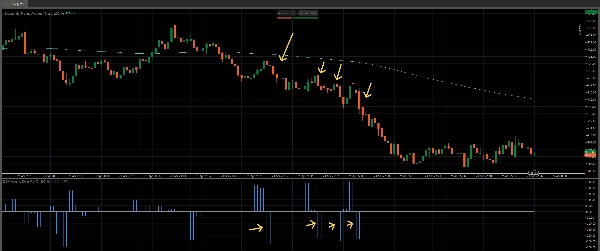
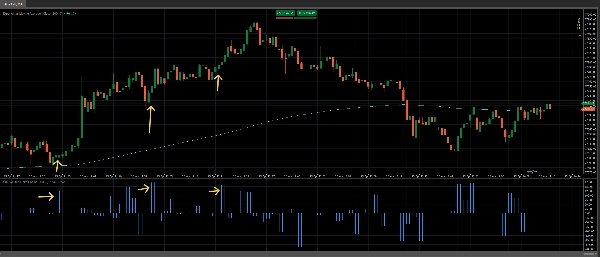
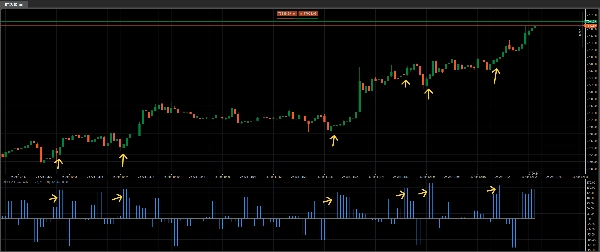
日内交易者,想看穿噪音。当蜡烛看涨但差异为负时,你知道要等待。当蜡烛看弱但差异强烈为正时,你知道机构正在积累。差异不会说谎——它显示的是发生了什么,而不是看起来怎样。
剥头皮交易者,需要知道哪一方 此刻掌控局面。突破时差异的激增确认其真实性。差异平坦的突破告诉你这是一个陷阱,甚至在反转开始之前。
波段交易者,寻求共识。差异背离——价格创新低但差异上升——是专业交易中最可靠的反转信号之一。此指标自动检测这些信号。
任何在cTrader上交易外汇、指数或商品,且经纪商提供Level 2数据。Fusion Markets、IC Markets、Go Markets及类似的ECN/STP经纪商均提供此指标读取的DOM数据。
如果你曾经站在“高成交量”蜡烛的错误一方,这就是告诉你原因的工具。
你将获得
一个干净、专业的直方图,显示在你的图表下方,展示每根柱子的净差异,基于高度准确的数据。正柱表示买方占主导。负柱表示卖方占主导。柱子的大小显示 哪一方占优势。与200均线等指标结合使用,提供共识和高概率交易机会。
无杂乱。无滞后的成交量移动平均线。无“估算”买卖的彩色蜡烛。只有激进买入和激进卖出之间的原始、未过滤差异——基于散户交易者可获得的最深层数据源计算。
此指标还提供使用成交量过滤器的选项,仅显示最重要的柱子。可按需聚合成交量柱。
一眼看差异柱,就能了解其他十个指标试图近似的内容。立即为cTrader获取你的版本。这个低价绝对值得。
将此与我们的Volume Profile Pro指标结合使用,在关键水平做出更明智的决策: https://ctrader.com/products/4079
查看我们惊人的Black Box Bot: https://ctrader.com/products/3241
摘要
The indicator displays a clean histogram below the chart representing net volume delta per bar: positive bars indicate buyer dominance, negative bars indicate seller dominance, and bar size reflects the strength of that dominance. This provides traders with insight into market intent beyond total volume, revealing whether buyers or sellers controlled the price action.
It supports forex, indices, and commodities trading with brokers offering Level 2 data, such as Fusion Markets and IC Markets. Features include volume filtering and aggregated volume bars. The tool is suited for day traders, scalpers, and swing traders seeking to interpret order flow, confirm breakouts, detect divergences, and enhance decision-making with professional-level order flow data.
客户评价
5 | 50 % | |
4 | 50 % | |
3 | 0 % | |
2 | 0 % | |
1 | 0 % |