

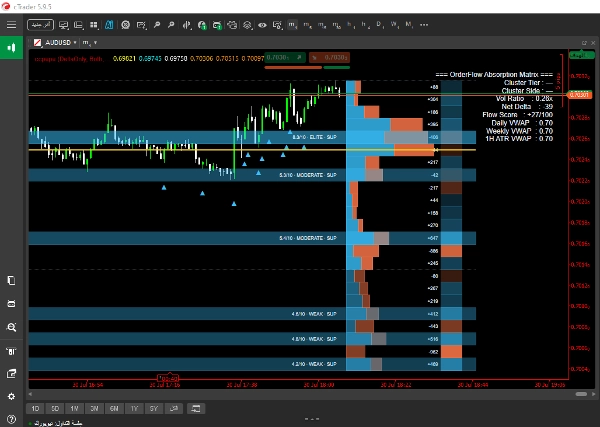
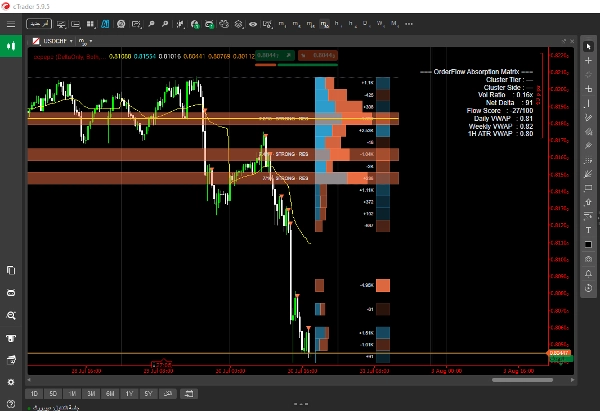
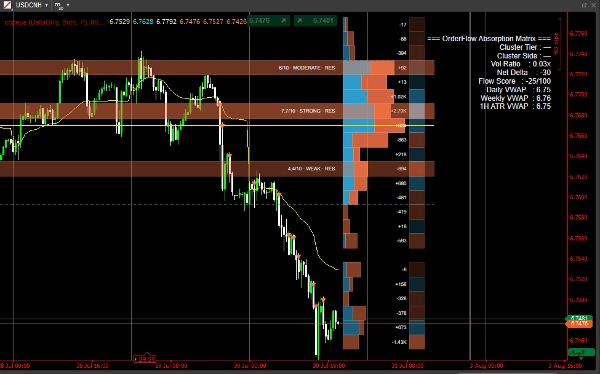
说明
1️⃣ 订单流和Delta检测
- 较低时间框架(LTF)钻取: 指标检查每个当前K线内的较低时间框架蜡烛数据(例如1分钟K线)以计算:
-
- 净Delta: 买卖量之间的净差额。
- 吸收: 在K线极端位置交易的大量成交量未能推动价格进一步上涨,表明大型被动限价单正在吸收市场流动性。
- 鲸鱼印记检测: 利用动态 百分位数,在三个不同的回溯窗口(短期、中期、长期)中计算,并结合可自定义的 共识引擎,以隔离真正的机构成交量激增。
2️⃣ 自适应成交量轮廓引擎
- 区间分割: 将历史价格区间(回溯K线)分割成等高的价格区间。
- 成交量分布: 分离每个区间的买入量、卖出量和Delta,在图表右侧绘制比例横向轮廓条。
- 动态时间框架处理: 指标不依赖固定秒数刻度,而是动态评估真实K线跨度(
GetCurrentBarSpan)。这避免了非标准时间框架和市场交易时段中断(如股票市场隔夜跳空)导致的轮廓坍塌或线条失真。 - 价值区和POC计算:
-
- POC(控制点): 识别最高成交量的价格水平,并用显著的锚线突出显示。
- 价值区(VA): 动态隔离核心成交量百分比(例如70%),并绘制 价值区高点(VAH) 和 价值区低点(VAL)。
3️⃣ 加权多因素区域评分系统
每个价格区间持续使用加权多因素公式进行评估,评分范围为1到10:
Score=w1⋅Volume+w2⋅Absorption+w3⋅Touches+w4⋅Rejections+w5⋅Recency
- 自动区域轮廓: 高分级别(精英或强劲)被投射到图表上,作为动态支撑/阻力区域,并配有实时数值强度徽章。
4️⃣ 锚定VWAP信号和执行触发器
- 计算锚定于关键时间节点(每日、每周和每月开始)的VWAP基准线。
- 交叉分析价格行为相对于锚定VWAP以及高成交量的 簇触发器,直接在图表上绘制精准的入场箭头。
5️⃣ 屏幕分析仪表盘
一个干净的实时HUD,可放置在您选择的任何图表角落,提供市场状况的即时摘要:
- 簇等级: 当前K线分类(鲸鱼、中等、小型)。
- 簇方向和净Delta: 方向性流动性偏向和精确的Delta数值。
- 成交量比率: 当前成交量相对于移动平均线。
- 流动评分: 归一化的动量/订单流评分,范围从−100到+100。
- VWAP基准: 活动VWAP水平的实时数值
摘要
AI 摘要
OrderFlow Absorption Matrix is an advanced indicator for cTrader that provides detailed order flow and volume profiling to identify institutional trading activity. It analyzes lower timeframe candle data to calculate net delta (buy vs. sell volume) and absorption, highlighting heavy volume at bar extremes where price fails to move further, indicating large passive limit orders. The indicator detects significant volume spikes ("Whale Prints") using dynamic percentiles across multiple lookback windows combined with a consensus engine.
It features an adaptive volume profile engine that segments historical price ranges into equal bins, displaying buy volume, sell volume, and delta per bin with proportional horizontal bars. The profile dynamically adjusts for varying timeframes and market session breaks, calculating key levels such as Point of Control (highest volume price) and Value Area (core volume range).
A weighted multi-factor scoring system continuously evaluates price bins based on volume, absorption, touches, rejections, and recency, projecting high-scoring zones as dynamic support/resistance levels with numeric strength indicators. Anchored VWAP lines are calculated for key time anchors (day, week, month) and combined with volume cluster triggers to plot precise entry signals.
An on-screen analytics dashboard provides real-time summaries including cluster tier classification, directional delta, volume ratios, momentum scores, and VWAP benchmarks, aiding in market condition assessment and trade decision-making.
It features an adaptive volume profile engine that segments historical price ranges into equal bins, displaying buy volume, sell volume, and delta per bin with proportional horizontal bars. The profile dynamically adjusts for varying timeframes and market session breaks, calculating key levels such as Point of Control (highest volume price) and Value Area (core volume range).
A weighted multi-factor scoring system continuously evaluates price bins based on volume, absorption, touches, rejections, and recency, projecting high-scoring zones as dynamic support/resistance levels with numeric strength indicators. Anchored VWAP lines are calculated for key time anchors (day, week, month) and combined with volume cluster triggers to plot precise entry signals.
An on-screen analytics dashboard provides real-time summaries including cluster tier classification, directional delta, volume ratios, momentum scores, and VWAP benchmarks, aiding in market condition assessment and trade decision-making.
指标配置
指标分类
统计数据
输出类型
过滤器
数据要求
跳动点数据
支持的信号
突破水平位
触及水平位
反转
背离
客户评价
0.0
评价:0
客户评价
该产品尚无评价。已经试过了?抢先告诉其他人!
讨论
常见问答
Bollinger Bands
Key Levels
Volume
Supply & Demand
VWAP
Support & Resistance
cTrader Store 提供的所有产品,包括交易机器人、指标和插件,均由第三方开发者提供,仅供信息参考和技术访问之用。cTrader Store 并非经纪商,不提供投资建议、个人推荐或任何未来业绩保证。
猜您喜欢

















价格
注册日期 23/06/2025
1
销售