present
ลงทะเบียนและรับส่วนลด $50 สำหรับการซื้อครั้งแรกของคุณ
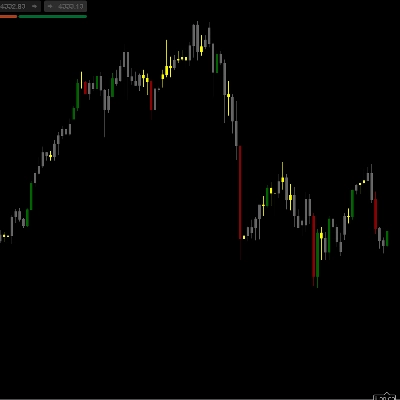
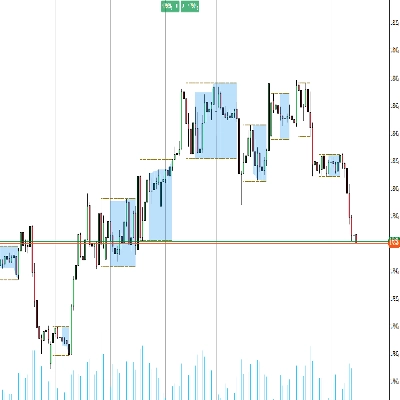
Trading product for StrongSupertrend อินดิเคเตอร์ Keltner Channels Key Levels, image 1
StrongSupertrend
อินดิเคเตอร์
เวอร์ชัน 1.0, Oct 2026
Windows, Mac
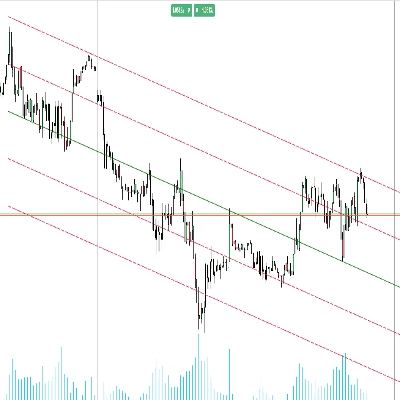
Trading product for StrongSupertrend อินดิเคเตอร์ Keltner Channels Key Levels, image 2
Trading product for StrongSupertrend อินดิเคเตอร์ Keltner Channels Key Levels, image 3
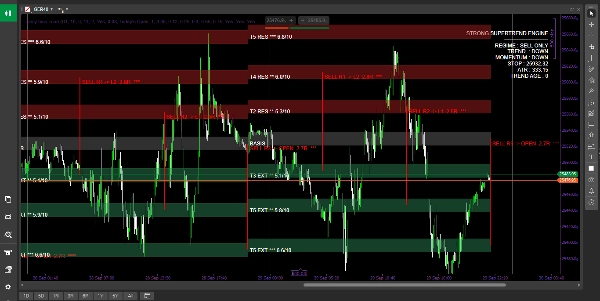
Trading product for StrongSupertrend อินดิเคเตอร์ Keltner Channels Key Levels, image 4
ตั้งแต่ 23/06/2025
1
การขาย

คำอธิบาย

Strong Supertrend Turn Market Movement into a Clear Map

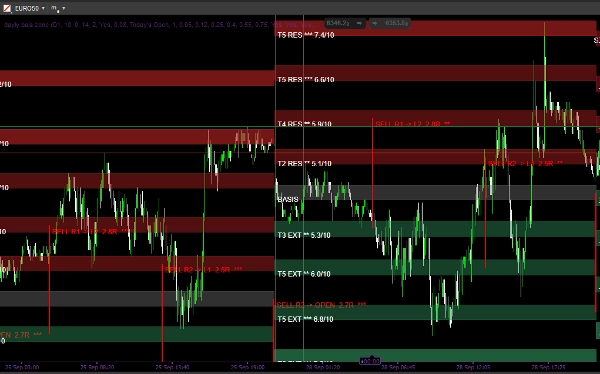
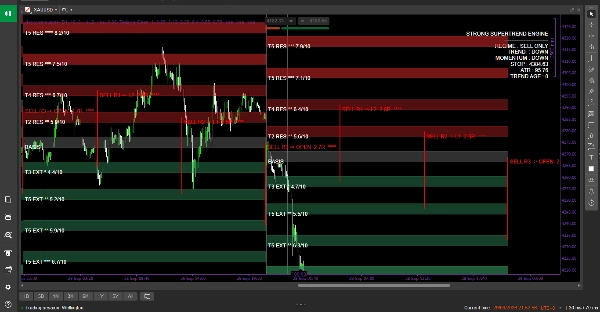
Market analysis is no longer just about searching for a buy or sell signal. The Strong Supertrend Engine is designed to give you a broader view of the market by transforming trend, volatility, momentum, and price zones into an easy-to-read dynamic map. The indicator relies on the Supertrend, ATR, and Basis to build a clear market structure, then identifies multiple levels around the price and evaluates the strength of each zone with a score from 0 to 10 to help you identify the areas worth watching. Through Laguerre Momentum analysis and a custom Dashboard interface, you can see the trend, momentum status, and market level at a glance, alongside potential continuation scenarios and risk-to-reward ratios. The indicator is not merely a tool that gives you an arrow on a chart; rather, it is a comprehensive analysis system that translates complex price action into an organized map, helping you understand where the market is moving, what the key zones are, and when you need further confirmation before making a decision.

How to Use: Start by reading the Dashboard to determine the overall market condition, trend, and momentum. Then, use the Basis as a reference point to understand the price position, while monitoring the five zone layers above and below it, paying closer attention to higher-rated zones. Use the Supertrend zone as an additional reference for the trend and for support or resistance, and watch how the price interacts with the specified zones instead of entering blindly the moment price reaches them. Afterward, a smaller timeframe can be used to confirm price action and determine the entry point, stop loss, and target. Meanwhile, the Continuation scenarios displayed by the indicator serve as potential visualizations of continuing movement rather than automated trading orders. In this way, the indicator functions as a decision-making map: it defines the context and critical zones first, leaving the trader responsible for entry confirmation and risk management.

สรุป

AI summary
StrongSupertrend is a comprehensive trading indicator that transforms market movement into a clear, dynamic map by integrating trend, volatility, momentum, and price zones. It combines Supertrend, Average True Range (ATR), and Basis calculations to construct a structured market overview, highlighting multiple price levels with strength scores ranging from 0 to 10. The indicator incorporates Laguerre Momentum analysis and presents data through a custom Dashboard interface, enabling users to quickly assess trend direction, momentum status, key market zones, and potential continuation scenarios alongside risk-to-reward ratios.

Users start by interpreting the Dashboard to gauge overall market conditions, then use the Basis as a price reference point while monitoring five zone layers above and below it, focusing on higher-rated zones. The Supertrend zone serves as an additional trend and support/resistance reference. Price interactions with these zones guide decision-making rather than triggering automatic entries. Traders can confirm entries, stop losses, and targets using smaller timeframes. Continuation scenarios provide visual forecasts of possible market moves without automated orders. This indicator functions as a decision-making tool that organizes complex price action into an accessible format, supporting informed trading decisions. It supports visualization outputs and signals including trend strength, volatility regime, level breaks, and level touches, relying on bar and volume data inputs.
โปรไฟล์อินดิเคเตอร์
หมวดหมู่อินดิเคเตอร์
Trend
ประเภทเอาต์พุต
การแสดงเป็นภาพ
ข้อกำหนดด้านข้อมูล
แท่งเท่านั้น
ปริมาณ
สัญญาณที่รองรับ
ความแข็งแกร่งของแนวโน้ม
ความผันผวน
เบรก Level ที่ระบุ
แตะ Level ที่ระบุ

รีวิวจากลูกค้า

0.0
รีวิว: 0
รีวิวจากลูกค้า
ยังไม่มีรีวิวสำหรับผลิตภัณฑ์นี้ หากเคยลองแล้ว ขอเชิญมาเป็นคนแรกที่บอกคนอื่น!

การสนทนา

คำถามที่พบบ่อย

Keltner Channels
Key Levels
ATR
Wedge
ผลิตภัณฑ์ที่มีให้บริการผ่าน cTrader Store รวมถึงบอทการเทรด อินดิเคเตอร์ และปลั๊กอิน มีให้บริการโดยนักพัฒนาบุคคลที่สามและมีไว้เพื่อวัตถุประสงค์ในการเข้าถึงข้อมูลและทางเทคนิคเท่านั้น cTrader Store ไม่ใช่โบรกเกอร์และไม่ได้ให้คำแนะนำการลงทุน คำแนะนำส่วนบุคคล หรือการรับประกันผลการดำเนินงานในอนาคต

เพิ่มเติมจากผู้เขียนคนนี้

อินดิเคเตอร์
VWAP
Volume
+4
Advanced Order Flow & Volume Profiling for cTrader. Unveil institutional footprints, Delta, and Anchored VWAPs.

นอกจากนี้คุณยังอาจชอบ

"RangePulsePro" โลโก้
ใหม่
5.0
(1)
$35
อินดิเคเตอร์
Risk Dashboard
AI-powered daily range forecasts help traders spot volatility opportunities and plan stops and targets.
อินดิเคเตอร์
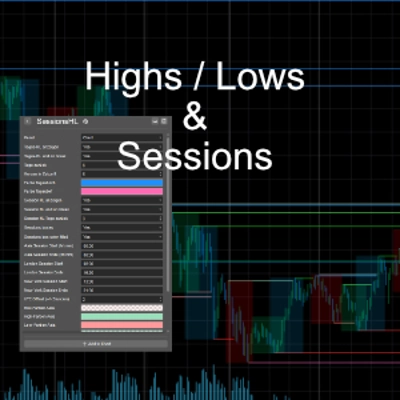
Shows daily and sessions highs / lows and session boxes, everything configurable
อินดิเคเตอร์
Grid
Prop
+14
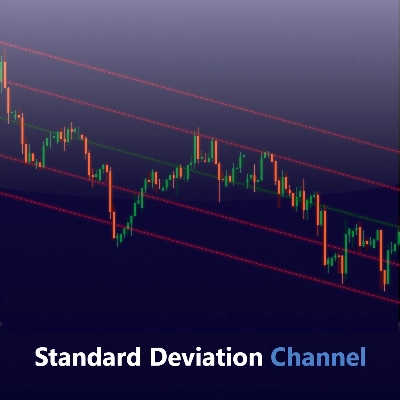
Visualize trends with Standard Deviation Channel! Display median, and add customizable upper/lower deviation channels.
อินดิเคเตอร์
ATR
RSI
+1
Super Trend Rsi ,ATR + trend change distance + dynamic Alpha, divergence/convergence
อินดิเคเตอร์
Visually master the Inside Bar strategy with clear breakout signals and professional chart highlighting 📈🔔📉
อินดิเคเตอร์
ATR
The Tenkan-ATR Indicator is a powerful and innovative indicator for Traders. SALE OFF!!!
อินดิเคเตอร์
Drawdown Monitor
Protect your funded account. Real-time Daily Equity Drawdown monitor with Green / Orange / Red flashing alerts.
"MACD Pro Trader" โลโก้
ยอดนิยม
4.6
(5)
$19
/
$20
อินดิเคเตอร์
MACD
Forex
+5
🚀 MACD Pro Trader – Advanced MACD with buy/sell signals, custom MAs & color-coded histograms for smarter trading! 📈🔥
"Chandelier Exit" โลโก้
ยอดนิยม
4.3
(3)
$19
/
$20
อินดิเคเตอร์
ATR
Prop
+14
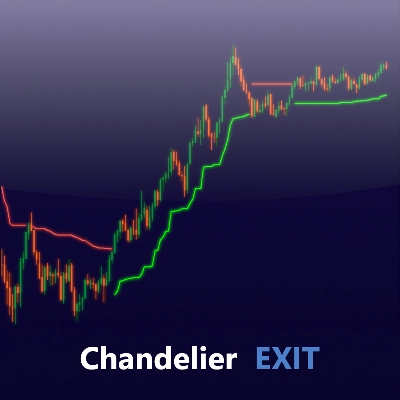
Optimize exits with Chandelier Exit! Visualize stop-loss points dynamically for improved trading precision and safety.
อินดิเคเตอร์
Key Levels
Market Structure
+1
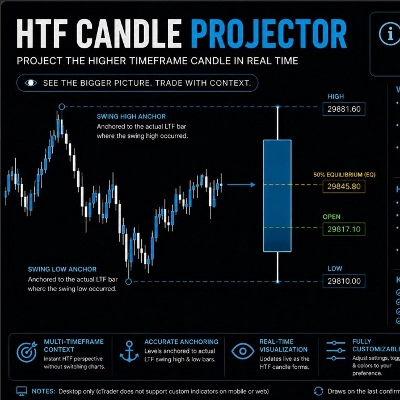
HTF Candle Projector displays the current Higher Timeframe candle (4H or 1H) as a real projected candle LIVE..
"Sniper Zone Pro" โลโก้
ยอดนิยม
4.5
(4)
$20
อินดิเคเตอร์
Forex
BTCUSD
+13
Sniper Zone Pro: High-precision institutional zones and candle strength for identifying key market tests.
อินดิเคเตอร์
SMC
Prop
+5
Automatically draws the Opening Range (High & Low) for Tokyo, London, and New York sessions. Configurable start times,
อินดิเคเตอร์
Prop
Forex
+5
Transform your approach to trading with our innovative Pivot Point Indicator.
อินดิเคเตอร์
Forex
BTCUSD
+10
🎯Smart Signals : Auto Buy/Sell alerts with dynamic TP/SL algorithm. 💡
อินดิเคเตอร์
VWAP
Volume
+5
Multi VWAP. Three timeframes. One clean chart. Your Essential Trading Tool.
อินดิเคเตอร์
Prop
Forex
+12
Identify and trade breakouts with Consolidation Zones! Visualize price consolidation areas for trading opportunities.
อินดิเคเตอร์
Forex
BTCUSD
+11
Visualize trends with Standard Deviation Channel! Display median, and add customizable upper/lower deviation channels.
อินดิเคเตอร์
Boost your trading with Candlestick Patterns for cTrader – auto-detect key signals for smarter, faster decisions!

ราคา

ตั้งแต่ 23/06/2025
1
การขาย