

present
ลงทะเบียนและรับส่วนลด $50 สำหรับการซื้อครั้งแรกของคุณ
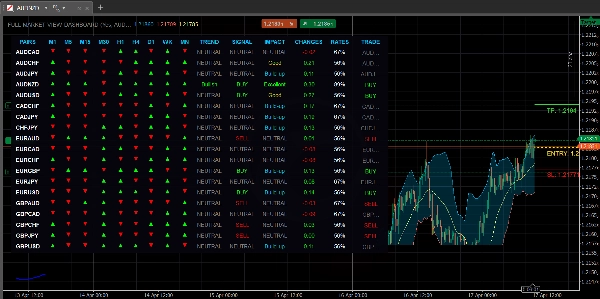
Trading product for FULL-MARKET-VIEW-DASHBOARD อินดิเคเตอร์ EMA Bollinger Bands, image 1
FULL-MARKET-VIEW-DASHBOARD
อินดิเคเตอร์
1 การซื้อ
เวอร์ชัน 1.1, Apr 2026
Windows, Mac
5.0
รีวิว: 2
Trading product for FULL-MARKET-VIEW-DASHBOARD อินดิเคเตอร์ EMA Bollinger Bands, image 2
Trading product for FULL-MARKET-VIEW-DASHBOARD อินดิเคเตอร์ EMA Bollinger Bands, image 3
Trading product for FULL-MARKET-VIEW-DASHBOARD อินดิเคเตอร์ EMA Bollinger Bands, image 4
Trading product for FULL-MARKET-VIEW-DASHBOARD อินดิเคเตอร์ EMA Bollinger Bands, image 5
Trading product for FULL-MARKET-VIEW-DASHBOARD อินดิเคเตอร์ EMA Bollinger Bands, image 6
Trading product for FULL-MARKET-VIEW-DASHBOARD อินดิเคเตอร์ EMA Bollinger Bands, image 7
Trading product for FULL-MARKET-VIEW-DASHBOARD อินดิเคเตอร์ EMA Bollinger Bands, image 8
Trading product for FULL-MARKET-VIEW-DASHBOARD อินดิเคเตอร์ EMA Bollinger Bands, image 9
Trading product for FULL-MARKET-VIEW-DASHBOARD อินดิเคเตอร์ EMA Bollinger Bands, image 10
ตั้งแต่ 27/02/2026
33.16K
ปริมาณการเทรด
25.96K
Pips ที่ได้กำไร
10
การขาย
421
ติดตั้งฟรี

คำอธิบาย

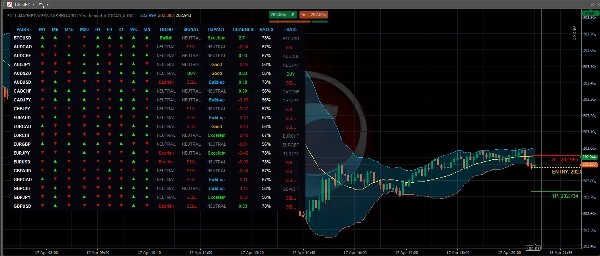
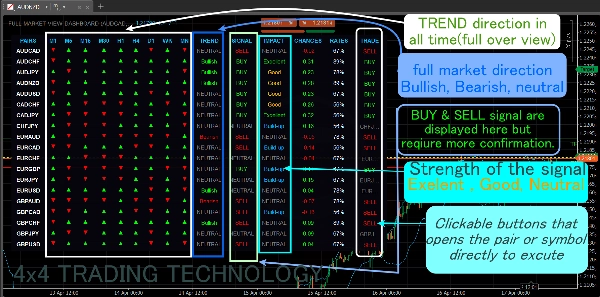
💎 แดชบอร์ดมุมมองตลาดเต็มรูปแบบ: รุ่นพรีเมียม 📈

เครื่องสแกนหลายกรอบเวลาที่สมบูรณ์แบบ & ผู้จัดการความเสี่ยงอัตโนมัติสำหรับ cTrader.

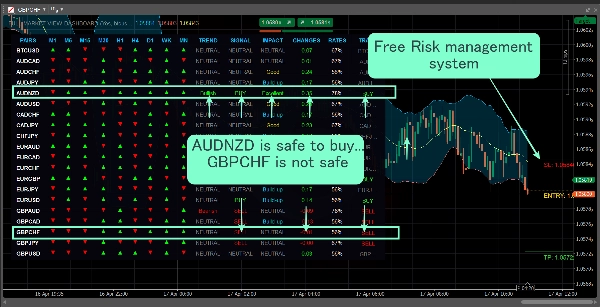
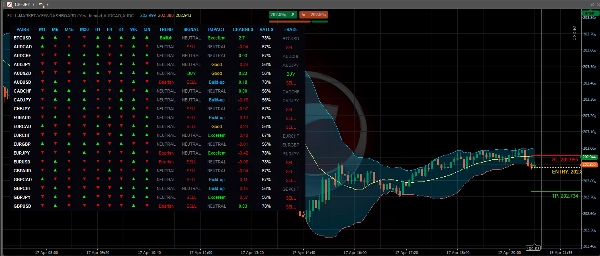
🛑 หยุดเดาและเริ่มเทรดด้วยความแม่นยำของอัลกอริทึม แดชบอร์ดมุมมองตลาดเต็มรูปแบบรุ่นพรีเมียมเป็นชุดเทรดครบวงจรที่ให้คุณเห็นภาพรวม "มุมมองนก" 🦅 ของคู่สกุลเงินสูงสุดถึง 28 คู่ พร้อมด้วย ผู้จัดการความเสี่ยงแบบเครื่องสถานะ 🧠 ที่จัดการการเข้าตลาด การตั้งจุดหยุดขาดทุน และการทำกำไรหลายระดับโดยอัตโนมัติอย่างสมบูรณ์ 👐✨

🚀 อะไรใหม่ในอัปเดตพรีเมียม?

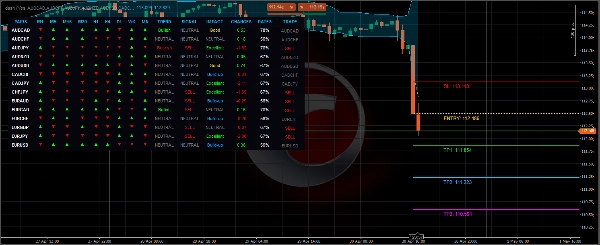
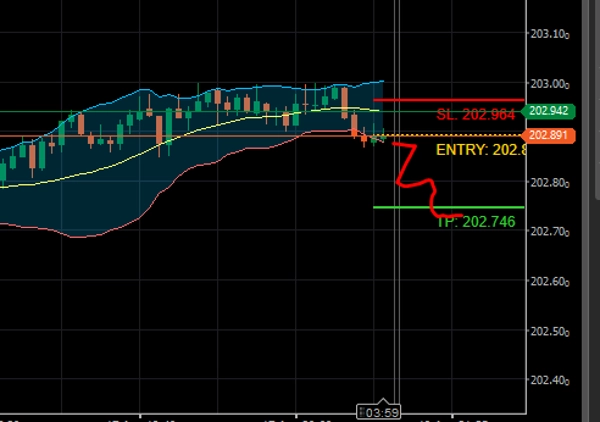
1. เครื่องสถานะเป้าหมายหลายจุด "เส้นผี" 👻🎯 ผู้จัดการความเสี่ยงได้รับการปรับปรุงใหม่ทั้งหมด ไม่ได้แค่ลากเส้นคงที่อีกต่อไป—มันมี หน่วยความจำ.

  • การปรับขนาด TP หลายระดับ ⚖️: อัลกอริทึมคำนวณและล็อก TP1, TP2, และ TP3 ตามการวัดความผันผวน ATR (ช่วงจริงเฉลี่ย) อย่างแม่นยำ 📏
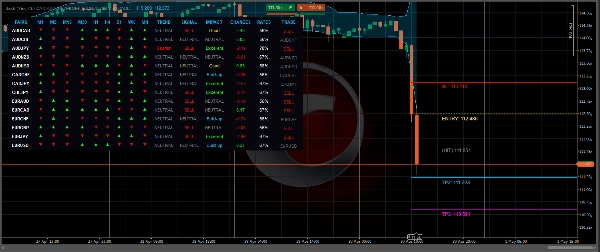
  • การเก็บบันทึกภาพ 🗂️✅: เมื่อราคาตลาดถึงจุดทำกำไร เส้นเป้าหมายที่เป็นเส้นทึบจะไม่หายไปทันที แต่จะเปลี่ยนเป็น เส้นประ "เส้นผี" ที่มีป้ายกำกับ (HIT) เพื่อบันทึกภาพความสำเร็จของการเทรดบนชาร์ตอย่างถาวร 🏆
  • ล้างชาร์ตอัตโนมัติ 🧹✨: เมื่อจุดหยุดขาดทุนถูกแตะ หรือทำกำไรทั้งหมดเต็ม ระบบจะลบเส้นที่ยังใช้งานอยู่ทั้งหมด ทำให้ชาร์ตของคุณพร้อมสำหรับการตั้งค่าครั้งใหญ่ถัดไป

2. ตรรกะ "ยกเลิกกลับทิศทาง" ระดับสถาบัน 🔄🛡️ ตลาดเปลี่ยนแปลงอย่างรวดเร็ว และตัวชี้วัดของคุณก็ควรเปลี่ยนตาม ⚡ หากคุณอยู่ในสถานะ "ซื้อ" ที่กำลังทำงานอยู่ แต่ตลาดเปลี่ยนแปลงทันทีและสร้างสัญญาณ "ขาย" ที่ถูกต้องตามคณิตศาสตร์ อัลกอริทึมจะเปิดใช้งาน การยกเลิกกลับทิศทาง ทันที มันจะลบการตั้งค่าที่ล้มเหลวเก่าและวาดเป้าหมายสั้นใหม่ให้คุณ เพื่อให้คุณไม่ติดอยู่ในฝั่งที่ผิดของตลาด 📉🏃‍♂️

3. การตรวจจับสัญลักษณ์ที่ป้องกันการล่ม 🛡️🔌 โบรกเกอร์ใช้ชื่อคู่สกุลเงินต่างกัน (เช่น EURUSD.c, EURUSD_raw) แดชบอร์ดพรีเมียมมี "ตาข่ายนิรภัย" 🕸️ ที่สแกนข้อมูลฟีดของโบรกเกอร์เฉพาะของคุณ หากสัญลักษณ์หายไปหรือพิมพ์ผิด แดชบอร์ดจะข้ามอย่างนุ่มนวลแทนที่จะล่ม และจะกลับไปแสดงสัญลักษณ์ของชาร์ตที่ใช้งานอยู่โดยอัตโนมัติ 🧠✅

📊 คุณสมบัติหลักของแดชบอร์ด:

  • กฎ 7 ครั้ง การเห็นพ้องหลายกรอบเวลา 🎯: สแกน 9 กรอบเวลาแตกต่างกัน (M1 ถึง รายเดือน) พร้อมกัน หากกรอบเวลา 7 กรอบขึ้นไปตรงกัน จะเน้นแนวโน้มขาขึ้น Bullish 🟢 หรือแนวโน้มขาลง Bearish 🔴 ที่มีความน่าจะเป็นสูง
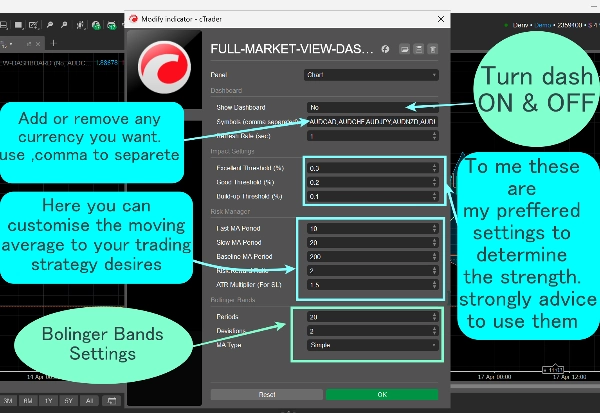
  • ตัวกรองเส้นฐาน EMA 200 🌊🚦: สัญญาณจากการตัดกันของค่าเฉลี่ยเคลื่อนที่เร็ว/ช้า จะทำงานเฉพาะเมื่อราคากำลังเทรดอย่างปลอดภัย ตาม แนวโน้ม EMA 200 ระดับมหภาค ป้องกันคุณจากสัญญาณหลอก 🛡️
  • ผลกระทบโมเมนตัมเรียลไทม์ 🏎️💨: คำนวณการเปลี่ยนแปลงเปอร์เซ็นต์รายวันโดยอัตโนมัติ จัดประเภทการเคลื่อนไหวของตลาดเป็น ยอดเยี่ยม, ดี หรือ สะสม เพื่อให้คุณรู้ว่ามีกำลังเหลืออยู่เท่าไร ⛽
  • สลับชาร์ตด้วยคลิกเดียว 🖱️⚡: คลิกที่คู่สกุลเงินใดก็ได้ในแดชบอร์ดเพื่อเปลี่ยนชาร์ตที่ใช้งานอยู่ทันทีและเข้าสู่การเทรดได้เลย

⚙️ วิธีการทำงานแบบเรียลไทม์:

  1. สแกน 🔍: ดูที่แดชบอร์ดเพื่อหาคู่ที่มีอัตราชนะ 80-100% และแนวโน้ม "ขาขึ้น" หรือ "ขาลง" ที่มั่นคง
  2. คลิก 🎯: คลิกปุ่ม "ซื้อ" หรือ "ขาย" บนแดชบอร์ดเพื่อเปิดชาร์ตนั้นทันที
  3. ดำเนินการ 🤖: รอให้ค่าเฉลี่ยเคลื่อนที่เร็ว/ช้าตัดกัน ทันทีที่แท่งเทียนปิด อัลกอริทึมจะล็อกการเข้าตลาด จุดหยุดขาดทุน และทำกำไรสูงสุดสามระดับบนหน้าจอ
  4. จัดการ 🍿💰: นั่งดูตลาดทำกำไรทีละเป้าหมายในขณะที่เปลี่ยนเป็นเส้นประ (HIT)! 🥂💸

สรุป

สรุปโดย AI
The FULL-MARKET-VIEW-DASHBOARD is a professional trading indicator suite designed for the cTrader platform. It provides a comprehensive multi-timeframe scanner that analyzes up to 28 currency pairs simultaneously across nine timeframes (from 1 minute to monthly). The dashboard identifies high-probability bullish or bearish macro trends using a "Rule of 7" consensus and filters signals with a 200 EMA baseline to reduce false entries.

Key features include an advanced State-Machine Risk Manager that automates trade management by setting entries, stop losses, and up to three take profit levels based on ATR volatility. The risk manager visually archives hit targets with dotted "ghost" lines and automatically clears charts after stop loss or full take profit execution. It also incorporates an institutional-grade "Reversal Override" logic to switch trade direction instantly when market conditions change.

The dashboard supports crash-proof symbol detection, adapting to broker-specific pair naming conventions to maintain stability. Real-time momentum impact is calculated to classify market movement strength. Users can switch charts instantly by clicking pairs within the dashboard, streamlining trade execution.

This indicator outputs signals related to crossovers, trend strength, level touches, breakouts, and session open ranges, relying on tick data for real-time analysis. It is categorized under statistics indicators and risk management tools.
โปรไฟล์อินดิเคเตอร์
หมวดหมู่อินดิเคเตอร์
สถิติ
ประเภทเอาต์พุต
สัญญาณ
ข้อกำหนดด้านข้อมูล
ข้อมูล Tick
สัญญาณที่รองรับ
Cross
ความแข็งแกร่งของแนวโน้ม
แตะ Level ที่ระบุ
Breakout
เบรก Level ที่ระบุ
Range ณ เวลาที่เปิดเซสชัน

รีวิวจากลูกค้า

5.0
รีวิว: 2
5
100 %
4
0 %
3
0 %
2
0 %
1
0 %
รีวิวจากลูกค้า
April 30, 2026
The first result can be misleading. Tracking 5 to 8 markets first, compare the result with 10 minute review, and only scale if 20 percent less clicking still looks controlled.
April 27, 2026
Would not overtrust it, but No reason to ignore it either. The use case is clear, and it helps if the setup is already disciplined. A clean journal needs both hit rate and average R.

การสนทนา

คำถามที่พบบ่อย

EMA
Bollinger Bands
Supertrend
Key Levels
Risk Dashboard
ATR
ผลิตภัณฑ์ที่มีให้บริการผ่าน cTrader Store รวมถึงบอทการเทรด อินดิเคเตอร์ และปลั๊กอิน มีให้บริการโดยนักพัฒนาบุคคลที่สามและมีไว้เพื่อวัตถุประสงค์ในการเข้าถึงข้อมูลและทางเทคนิคเท่านั้น cTrader Store ไม่ใช่โบรกเกอร์และไม่ได้ให้คำแนะนำการลงทุน คำแนะนำส่วนบุคคล หรือการรับประกันผลการดำเนินงานในอนาคต

เพิ่มเติมจากผู้เขียนคนนี้

อินดิเคเตอร์
Crypto
GBPUSD
+7
GUPPY TREND MASTER V3.. Visualize Market Sentiment with the 38-EMA Rainbow The Guppy Trend Master 4X4 Indicator
อินดิเคเตอร์
Market Structure
Stop guessing which trading session you in, with Sessions indicator sessions are in your finger tips like a pro
อินดิเคเตอร์
RSI
AI-assisted
+1
Transform how you view market momentum with the RSI Velocity Gauge Pro. It's FREE FOR ALL
"ALL-IN-ONE" โลโก้
ยอดนิยม
5.0
(3)
$19
/
$32
อินดิเคเตอร์
ATR
RSI
+11
This indicator puts three helpful trading tools on your chart at once. Think of it like having three expert traders
อินดิเคเตอร์
AI-assisted
Tired of staring at the same old charts? The Theme Customizer indicator brings a whole new level of personalization
อินดิเคเตอร์
Aggressive
Supertrend
+5
Stop trading with tunnel vision! 🚫 The Heat Map Dashboard is an institutional-grade visual trading assistant

นอกจากนี้คุณยังอาจชอบ

อินดิเคเตอร์
VWAP
Volume
+5
Institutional Nasdaq Session VWAP & 3-Sigma Deviation Framework. Live NY Session Tracking, Real-Time Point Metrics, Wick
อินดิเคเตอร์
ATR
Prop
+14
Optimize exits with Chandelier Exit! Visualize stop-loss points dynamically for improved trading precision and safety.
อินดิเคเตอร์
SMC
Grid
+19
Smart fractals + auto Fibonacci + dynamic S/R zones with HTF confluence & Bull/Bear bias panel. Institutional-grade.
"Supertrend - Multi-Timeframe" โลโก้
เรตติ้งสูง
4.2
(4)
$19
/
$25
อินดิเคเตอร์
Prop
Forex
+13
Supertrend - Multi-Timeframe Indicator
อินดิเคเตอร์
Triangle
Double Top
+5
Know which liquidity sweeps are real. Auto-tracks EQH/EQL and confirms genuine reversals, not just broken levels.
อินดิเคเตอร์
VWAP
Forex
+13
Custom VWAP Indicator for cTrader
อินดิเคเตอร์
Pin Bar
Inducement
+5
Institutional Nasdaq Session Liquidity Map with Live Point HUD, Sweep Alerts & Interactive Playbook.
"Gold Emperor" โลโก้
ยอดนิยม
4.7
(4)
$20
/
$40
อินดิเคเตอร์
ATR
RSI
+5
Gold Emperor: AI-driven XAUUSD dominance. Dynamic pivots, matrix trend logic, and institutional shield protection.
"Osvolt Trend Hunter" โลโก้
เรตติ้งสูง
4.6
(5)
$19
/
$25
อินดิเคเตอร์
ATR
RSI
+16
Multi-timeframe trend indicator using EMA, MACD & ADX to confirm high-probability buy and sell bias.
อินดิเคเตอร์
Fibonacci
Key Levels
+5
Institutional Nasdaq-100 Auto-Fib Playbook for cTrader. Dynamic ICT 70.5% OTE Engine, NY Session Tracker, Real-Time Poin
"Supertrend Indicator" โลโก้
ยอดนิยม
4.4
(5)
$19
/
$30
อินดิเคเตอร์
AI
ATR
+27
Supertrend Indicator
อินดิเคเตอร์
Prop
Institution-level trend Analyzer.
อินดิเคเตอร์
RSI
Volume
+3
Auto-detects swings, Includes POC, Value Area (VAH/VAL), High Volume Nodes (HVN), Fibonacci retracement, and RSI overlay
"Divergence Suite VPro" โลโก้
เรตติ้งสูง
4.5
(4)
$25
/
$39
อินดิเคเตอร์
RSI
SMC
+17
RSI, MACD, Stochastic, CCI & Momentum divergence scanner with confluence scoring. Never miss a signal again!
อินดิเคเตอร์
RSI
SMC
+3
High Low Divergence is a clean, overlay indicator that automatically identifies swing highs and swing lows
"TDI_Pro" โลโก้
ยอดนิยม
4.3
(3)
$39
/
$59
อินดิเคเตอร์
RSI
BTCUSD
+5
Traders Dynamic Index (TDI) — Divergence Edition
"Supertrend-algo" โลโก้
ยอดนิยม
4.3
(3)
$19
/
$29
อินดิเคเตอร์
AI
ATR
+20
Algorithmic trend precision for cTrader.
อินดิเคเตอร์
ATR
BOS
+3
Fair Value Gaps with Multi-Timeframe.

ราคา

ตั้งแต่ 27/02/2026
33.16K
ปริมาณการเทรด
25.96K
Pips ที่ได้กำไร
10
การขาย
421
ติดตั้งฟรี
























