

OrderFlow Absorption Matrix
Indicatore
1 acquisti
Versione 1.0, Jul 2026
Windows, Mac
Da 23/06/2025
1
Vendite
Descrizione
1️⃣ Rilevamento del Flusso degli Ordini e del Delta
- Analisi a Timeframe Inferiore (LTF): L'indicatore esamina i dati delle candele a timeframe inferiore (ad esempio, barre da 1 minuto) all'interno di ogni barra corrente per calcolare:
-
- Delta Netto: La differenza netta tra volume di acquisto e di vendita.
- Assorbimento: Volume elevato scambiato agli estremi della barra che non riesce a spingere ulteriormente il prezzo, segnalando grandi ordini limite passivi che assorbono la liquidità di mercato.
- Rilevamento delle Impronte Whale: Utilizza Percentili dinamici calcolati su tre finestre di lookback distinte (Breve, Medio, Lungo) combinati con un Motore di Consenso personalizzabile per isolare veri picchi di volume istituzionale.
2️⃣ Motore del Profilo di Volume Adattivo
- Segmentazione dei Bin: Segmenta l'intervallo di prezzo storico (Lookback Bars) in bin di prezzo verticali uguali.
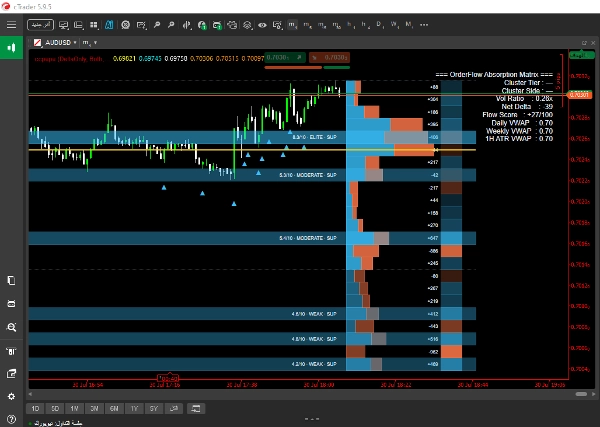
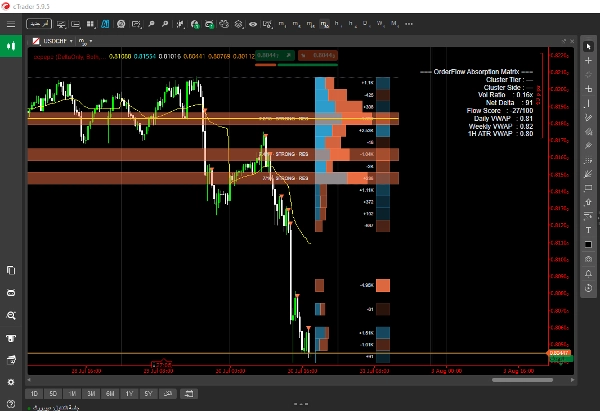
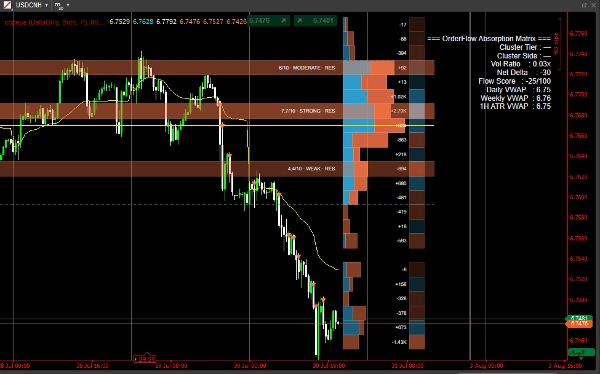
- Distribuzione del Volume: Separa il volume di acquisto, il volume di vendita e il delta per bin, rendendo barre di profilo orizzontali proporzionali sul lato destro del grafico.
- Gestione Dinamica del Timeframe: Invece di basarsi su tick a secondi fissi, l'indicatore valuta dinamicamente la durata reale delle barre (
GetCurrentBarSpan). Questo previene il collasso del profilo o la distorsione delle linee attraverso timeframe non standard e pause nelle sessioni di mercato (come gap overnight nel mercato azionario). - Calcolo dell'Area di Valore e del POC:
-
- POC (Punto di Controllo): Identifica il livello di prezzo con il volume più alto e lo evidenzia con una linea di ancoraggio prominente.
- Area di Valore (VA): Isola dinamicamente la percentuale centrale di volume (ad esempio, 70%) e disegna il Valore Alto dell'Area (VAH) e il Valore Basso dell'Area (VAL).
3️⃣ Sistema di Punteggio a Zone Multi-Fattore Ponderato
Ogni bin di prezzo viene continuamente valutato utilizzando una formula multi-fattore ponderata con punteggio da 1 a 10:
Score=w1⋅Volume+w2⋅Assorbimento+w3⋅Tocchi+w4⋅Rifiuti+w5⋅Recenza
- Profilazione Automatica delle Zone: Livelli con punteggi alti (Elite o Forti) sono proiettati sul grafico come zone dinamiche di supporto/resistenza complete di badge numerici di forza in tempo reale.
4️⃣ Segnali VWAP Ancorati e Trigger di Esecuzione
- Calcola linee di riferimento VWAP ancorate a cambiamenti temporali chiave (Inizio Giorno, Settimana e Mese).
- Analizza incrociando l'azione del prezzo rispetto ai VWAP ancorati insieme a Trigger di Cluster ad alto volume per tracciare frecce di ingresso precise direttamente sul grafico.
5️⃣ Cruscotto Analitico a Schermo
Un HUD pulito e in tempo reale posizionato in qualsiasi angolo del grafico a tua scelta fornisce un riepilogo immediato delle condizioni di mercato:
- Livello del Cluster: Classificazione della barra corrente (Whale, Medio, Piccolo).
- Lato del Cluster e Delta Netto: Bias direzionale della liquidità e numeri precisi del delta.
- Rapporto di Volume: Volume corrente rispetto alle medie mobili.
- Punteggio del Flusso: Un punteggio normalizzato di momentum/flusso ordini che varia da −100 a +100.
- Riferimenti VWAP: Valori in tempo reale per i livelli VWAP attivi
Riepilogo
Riepilogo AI
OrderFlow Absorption Matrix is an advanced indicator for cTrader that provides detailed order flow and volume profiling to identify institutional trading activity. It analyzes lower timeframe candle data to calculate net delta (buy vs. sell volume) and absorption, highlighting heavy volume at bar extremes where price fails to move further, indicating large passive limit orders. The indicator detects significant volume spikes ("Whale Prints") using dynamic percentiles across multiple lookback windows combined with a consensus engine.
It features an adaptive volume profile engine that segments historical price ranges into equal bins, displaying buy volume, sell volume, and delta per bin with proportional horizontal bars. The profile dynamically adjusts for varying timeframes and market session breaks, calculating key levels such as Point of Control (highest volume price) and Value Area (core volume range).
A weighted multi-factor scoring system continuously evaluates price bins based on volume, absorption, touches, rejections, and recency, projecting high-scoring zones as dynamic support/resistance levels with numeric strength indicators. Anchored VWAP lines are calculated for key time anchors (day, week, month) and combined with volume cluster triggers to plot precise entry signals.
An on-screen analytics dashboard provides real-time summaries including cluster tier classification, directional delta, volume ratios, momentum scores, and VWAP benchmarks, aiding in market condition assessment and trade decision-making.
It features an adaptive volume profile engine that segments historical price ranges into equal bins, displaying buy volume, sell volume, and delta per bin with proportional horizontal bars. The profile dynamically adjusts for varying timeframes and market session breaks, calculating key levels such as Point of Control (highest volume price) and Value Area (core volume range).
A weighted multi-factor scoring system continuously evaluates price bins based on volume, absorption, touches, rejections, and recency, projecting high-scoring zones as dynamic support/resistance levels with numeric strength indicators. Anchored VWAP lines are calculated for key time anchors (day, week, month) and combined with volume cluster triggers to plot precise entry signals.
An on-screen analytics dashboard provides real-time summaries including cluster tier classification, directional delta, volume ratios, momentum scores, and VWAP benchmarks, aiding in market condition assessment and trade decision-making.
Profilo indicatore
Categoria indicatore
Statistiche
Tipo di output
Filtro
Requisiti per i dati
Dati sui tick
Segnali supportati
Livello rotto
Livello raggiunto
Inversione
Divergenza
Discussioni
Recensioni dei clienti
0.0
Recensioni: 0
Recensioni dei clienti
Questo prodotto non ha ancora ricevuto recensioni. L'hai già provato? Fallo sapere agli altri per primo!
Domande frequenti
Bollinger Bands
Key Levels
Volume
Supply & Demand
VWAP
Support & Resistance
I prodotti disponibili tramite cTrader Store, inclusi bot di trading, indicatori e plugin, sono forniti da sviluppatori terzi e resi disponibili esclusivamente a scopo informativo e di accesso tecnico. cTrader Store non è un broker e non fornisce consulenze in materia di investimento, raccomandazioni individualizzate o garanzie di risultati futuri.
Altro da questo autore















Prezzo
Da 23/06/2025
1
Vendite