
ATR Bands
อินดิเคเตอร์
5 การซื้อ
เวอร์ชัน 1.0, Oct 2025
Windows, Mac
4.6
รีวิว: 3
คำอธิบาย
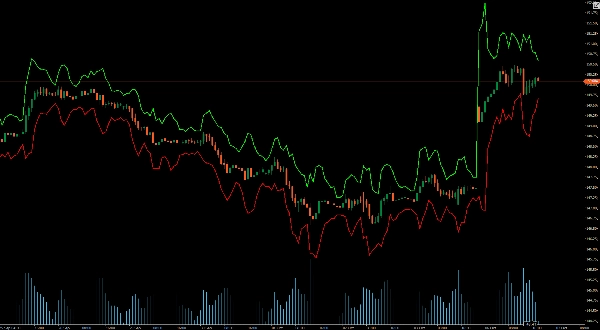
ATR Bands แสดงแถบบนและล่างบนแผนภูมิราคาของคุณอย่างไดนามิก
แถบเหล่านี้ให้ข้อมูลเชิงลึกแบบเรียลไทม์เกี่ยวกับความผันผวนของตลาด ช่วยให้คุณระบุจุดที่อาจเกิดการเบรกเอาท์และการกลับตัวได้อย่างแม่นยำ เหมาะสำหรับเทรดเดอร์ทุกระดับ ATR Bands ช่วยเพิ่มกระบวนการตัดสินใจของคุณโดยให้สัญญาณภาพที่ชัดเจนสำหรับการตั้งค่า stop-loss, take-profit และการเพิ่มประสิทธิภาพจุดเข้า
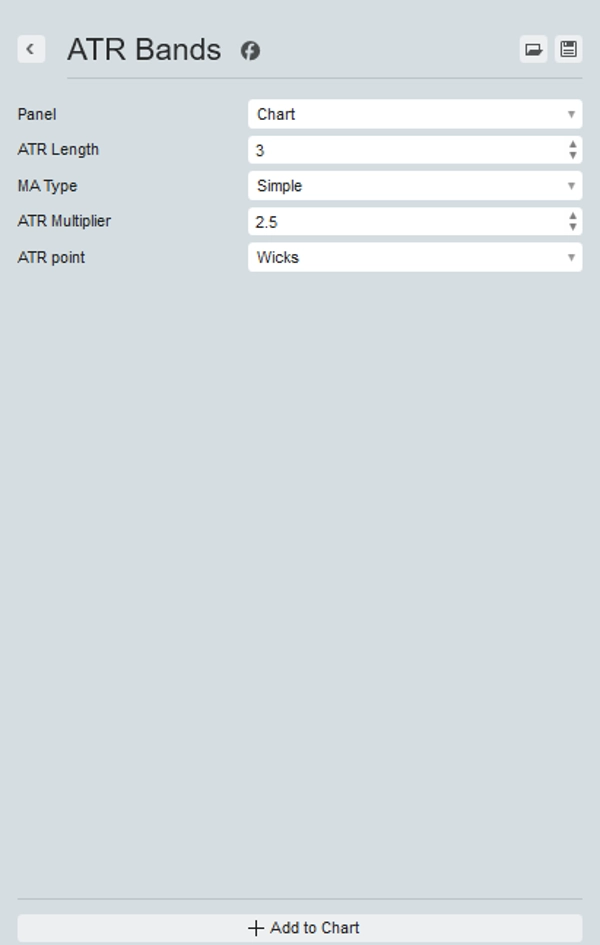
การตั้งค่าช่วยให้คุณเลือกช่วงเวลาที่ต้องการและตัวคูณ เปลี่ยนค่าเฉลี่ยเคลื่อนที่ที่ใช้ในการคำนวณ ATR และใช้ไส้เทียนหรือราคาปิดของเทียน
อัปเกรดชุดเครื่องมือการเทรดของคุณวันนี้และสัมผัสความแตกต่างกับ ATR Bands – ข้อได้เปรียบของคุณในตลาด
สรุป
สรุปโดย AI
ATR Bands is a trading indicator that dynamically plots upper and lower bands on price charts based on the Average True Range (ATR). These bands provide real-time visualization of market volatility, assisting traders in identifying potential breakout and reversal points. The indicator supports customizable settings, including the choice of period and multiplier, selection of the moving average type used to calculate ATR, and the option to base calculations on candle wicks or candle closes. ATR Bands are applicable across various markets such as Forex, cryptocurrencies (e.g., BTCUSD), commodities, indices, and stocks. By offering clear visual cues, this tool aids in optimizing entry points, as well as setting stop-loss and take-profit levels.
โปรไฟล์อินดิเคเตอร์
รีวิวจากลูกค้า
4.6
รีวิว: 3
5 | 67 % | |
4 | 33 % | |
3 | 0 % | |
2 | 0 % | |
1 | 0 % |
รีวิวจากลูกค้า
October 19, 2025
weak entries have a harder time slipping through, but risk control still needs say no.
October 14, 2025
The better read comes from there is a useful pause before the click, and a few signals across sessions tell more.
October 13, 2025
การสนทนา
คำถามที่พบบ่อย
BTCUSD
Forex
Breakout
Indices
EURUSD
Commodities
GBPUSD
NZDUSD
Prop
Crypto
Stocks
XAUUSD
NAS100
ATR
USDJPY
ผลิตภัณฑ์ที่มีให้บริการผ่าน cTrader Store รวมถึงบอทการเทรด อินดิเคเตอร์ และปลั๊กอิน มีให้บริการโดยนักพัฒนาบุคคลที่สามและมีไว้เพื่อวัตถุประสงค์ในการเข้าถึงข้อมูลและทางเทคนิคเท่านั้น cTrader Store ไม่ใช่โบรกเกอร์และไม่ได้ให้คำแนะนำการลงทุน คำแนะนำส่วนบุคคล หรือการรับประกันผลการดำเนินงานในอนาคต


ราคา
ตั้งแต่ 25/09/2025
25
การขาย
315
ติดตั้งฟรี