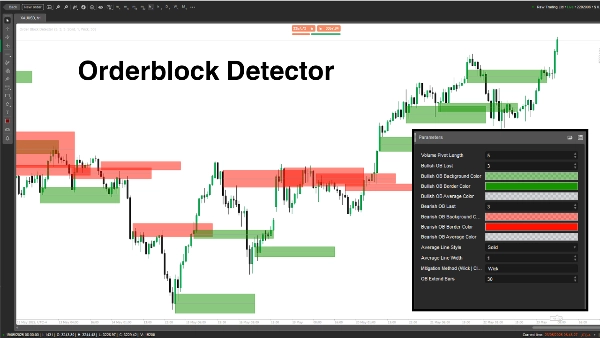
经纪商和自营
面向企业
00
Days
:
00
Hours
:
00
Minutes
:
00
Seconds
Order Block Finder
"Order Block Finder" 标识
注册日期 08/05/2025
交易量
74.64M
盈利点数
1.11M
免费安装
2477
"Order Block Finder" 已上传图片

The "Order Block Detector" indicator is built to spot and display Order Blocks (OBs) on the price chart—key zones where big players (institutions) place significant buy or sell orders, often triggering strong price reactions. It helps traders pinpoint potential support/resistance zones for smarter trade entries, stop-losses, or take-profits.

Concept

  • Order Blocks: These are price zones where the market reverses or pauses due to heavy institutional order flow. The indicator detects OBs by analyzing volume pivot highs and market state (bullish/bearish).
  • How it works:
    • Determines market state (bullish/bearish) by comparing highs/lows to a lookback period (Length).
    • Identifies OBs at volume peaks tied to key price levels.
    • Draws rectangles and average lines to mark OBs, while checking and removing mitigated OBs when price breaks through.
  • Use case: Traders can use OBs as high-probability zones for trade setups, risk management, or profit targets.

Parameter Breakdown

  1. Volume Pivot Length (Length, Default: 5, Min: 1)
    • What it does: Sets the lookback period (number of bars) for calculating highs/lows and volume pivot highs.
    • Why it matters: A longer length increases accuracy but reduces OB frequency; shorter length catches more OBs but may include noise.
  2. Bullish OB Last (BullExtLast, Default: 3, Min: 1)
    • What it does: Limits the number of bullish OBs stored and tracked.
    • Why it matters: Caps the number of displayed bullish OBs to keep the chart clean and optimize performance.
  3. Bullish OB Background Color (BgBullCss, Default: #80169400)
    • What it does: Sets the background color and transparency of bullish OB rectangles.
    • Why it matters: Helps visually distinguish bullish OBs on the chart.
  4. Bullish OB Border Color (BullCss, Default: #169400)
    • What it does: Defines the border color of bullish OB rectangles.
    • Why it matters: Enhances visibility of bullish OB zones.
  5. Bullish OB Average Color (BullAvgCss, Default: #609598A1)
    • What it does: Colors the average line within bullish OBs.
    • Why it matters: Marks the midpoint of the OB, serving as a key reference level for traders.
  6. Bearish OB Last (BearExtLast, Default: 3, Min: 1)
    • What it does: Limits the number of bearish OBs stored and tracked.
    • Why it matters: Like BullExtLast, keeps the chart uncluttered by capping bearish OBs.
  7. Bearish OB Background Color (BgBearCss, Default: #80FF1100)
    • What it does: Sets the background color and transparency of bearish OB rectangles.
    • Why it matters: Differentiates bearish OBs from bullish ones.
  8. Bearish OB Border Color (BearCss, Default: #FF1100)
    • What it does: Defines the border color of bearish OB rectangles.
    • Why it matters: Makes bearish OBs stand out for quick identification.
  9. Bearish OB Average Color (BearAvgCss, Default: #609598A1)
    • What it does: Colors the average line within bearish OBs.
    • Why it matters: Highlights the central price level of bearish OBs for trade planning.
  10. Average Line Style (LineStyle, Default: Solid)
    • What it does: Sets the style of the OB average line (Solid, Dashed, Dotted).
    • Why it matters: Customizes the look of the average line to suit trader preferences.
  11. Average Line Width (LineWidth, Default: 1, Min: 1)
    • What it does: Adjusts the thickness of the OB average line.
    • Why it matters: Controls how prominent the average line appears on the chart.
  12. Mitigation Method (Mitigation, Default: "Wick")
    • What it does: Defines how OBs are invalidated:
      • Wick: Uses the lowest price (bullish OB) or highest price (bearish OB) to check for mitigation.
      • Close: Uses the closing price to check for mitigation.
    • Why it matters: Affects how sensitive the indicator is to price breaking OB zones, impacting when OBs are removed.

The Order Block Detector is a powerful tool for spotting institutional order zones based on volume spikes and price action. It draws clear OB rectangles with average lines and removes invalidated ones dynamically. Traders can tweak parameters to fine-tune detection, display, and management of OBs to match their trading style.

5.0
评价:2
5
100 %
4
0 %
3
0 %
2
0 %
1
0 %
客户评价
December 18, 2025
THIS IS BY FAR THE BEST TOOL for OB's - as a beginner I can visually see where I am and Where I need to go - THANK YOU SO MUCH
August 12, 2025
Pros: Automatically identifies bullish and bearish order blocks based on swing breakouts with clear zones. Useful for visual SMC analysis. Cons: No alerts or tooltips. Lacks template saving and volume confirmation features. Slight delay under heavy chart load.
该作者的其他作品
评分最高
免费
High TF Plotter
Captra High TF Plotter visualizes high timeframe Bar on lower timeframe charts, highlighting with bull/bear colors.
Head Shoulders Finder
Detects Head & Shoulders patterns, plots signals, and alerts for trading opportunities.
Time Marker
CaptraTimeMarker: Marks key trading hours with lines & labels, plus daily separators for cTrader. Customizable & precise
Bar Explosion
cTrader indicator with mini-timeframe candlesticks. Customize timeframe, colors, margins. Perfect for traders.
指标
EURUSD
Compare Symbol
Plots chosen symbol's close price, candlestick (wick, body) on cTrader chart, supports multiple timeframes.
猜您喜欢
Previous Day Equilibrium (Premium & Discount)
Plots the equilibrium price levels based on previous daily highs and lows.
DEnvelopSystem
DEnvelop is a high-performance trading indicator engineered for scalpers and intraday strategists who demand precision.
指标
Martingale
Forex
Fibonacci
+24
Smart Floating Risk-Utimate version
📊 Smart Floating Risk Ultimate.Transform Your Risk Management with Real-Time Intelligence.
指标
NAS100
NZDUSD
XAUUSD
+11
TSI True Strength Index
Enhance trading with TSI! Use the True Strength Index for clear insights into market momentum and trend strength.
Daily Sessions HighLow Helper
Shows daily and sessions highs / lows and session boxes, everything configurable
指标
Breakout
ATR
Forex
+2
RangeFilter FREE Adaptive PriceFilter lite version
Lightweight adaptive filter with dynamic bands. Clean, noise-free trend structure.
指标
VWAP
VolumeRenkoRange
Volume for Renko/Range
指标
Breakout
PDHL
PDHL - Previous Day High&Low
指标
NAS100
Indices
Breakout
+6
All-in-One Session Levels Suite
Institutional Session Levels Pro OHLC,Prev(D,W,M OHLC)
指标
NAS100
XAUUSD
Commodities
+3
Volume Squeeze Time
Volume Squeeze, real-time buying and selling.
指标
Indices
FVG
Commodities
+4
FAIR VALUE GAP INDICATOR
Pinpoint FVGs, track fills and see mitigation stats — trade imbalances with clarity and confidence.
指标
Grid
NAS100
NZDUSD
+15
SystemAlgo1
Institutional Supply & Demand Mapping Across Five Timeframes — Automatically.
指标
NAS100
NZDUSD
Martingale
+22
Zigzag Trend
The ZigZag Trend is a market structure tool that filters out small price fluctuations and highlights major swing.
指标
RSI
Breakout
XAUUSD
+5
Prediction Based on Linreg & ATR
📊Predicts price movement by combining multi-timeframe trend analysis, market volatility 📉, and..
指标
Indices
RSI
Breakout
+9
Advanced HTF Trend Buy & Sell Trading System
Detects breakouts 📈 auto-draws levels 🚀 confirms trends 🐻 dynamic signals 🎨 customizable for any asset & timeframe.
Bar Explosion
cTrader indicator with mini-timeframe candlesticks. Customize timeframe, colors, margins. Perfect for traders.
Candle Timer & Strength Panel
Candle Timer & Strength Panel for cTrader Description: Candle Timer & Strength Panel is an advanced, always-visible over