
High TF Plotter
Индикатор
437 скачивания
Версия 1.0, May 2025
Windows, Mac
4.6
Отзывы: 3
Описание
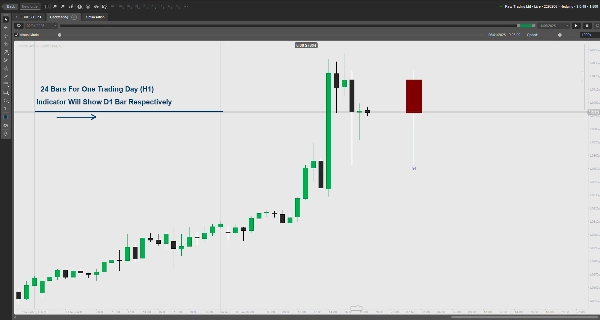
Отображает ценовое движение высокого таймфрейма на графиках с низким таймфреймом. Показывает открытие/закрытие, тени и ключевые зоны с бычьими/медвежьими цветами. Настраиваемый.
Основные функции:
- Накладывает ценовое движение высокого таймфрейма (например, дневного) на графики с низким таймфреймом.
- Отображает прямоугольники открытия/закрытия с настраиваемыми бычьими/медвежьими цветами.
- Выделяет зоны премии/скидки теней для ключевых ценовых уровней.
- Настраиваемый отступ для интервала между графиками.
- Обработка ошибок при неверных настройках таймфрейма.
Пожалуйста, оставьте отзыв, чтобы сообщить нам, полезен ли этот инструмент.
Сводка
ИИ-сводка
High TF Plotter is a trading indicator that overlays high timeframe price action onto lower timeframe charts. It visually represents open and close prices using customizable bull and bear colored rectangles. The tool highlights wick premium and discount zones to mark key price levels, aiding in the identification of significant market areas. Users can adjust chart spacing through a configurable margin setting. The indicator includes error handling for invalid timeframe inputs, ensuring reliable operation. This functionality supports analysis by combining broader timeframe context with detailed lower timeframe data.
Профиль индикатора
Отзывы покупателей
4.6
Отзывы: 3
5 | 67 % | |
4 | 33 % | |
3 | 0 % | |
2 | 0 % | |
1 | 0 % |
Отзывы покупателей
January 27, 2026
It would have been very helpful if it were possible to configure the time for NY EST
August 18, 2025
Clear higher timeframe level plotting, customizable, lightweight. Cons: No auto-labels, no multi-timeframe overlays, no alerts.
May 29, 2025
Muito bom, mas se tivesse a linha de abertura, máxima e mínima seria perfeito. Obrigada.
Обсуждение
Частые вопросы
Продукты, доступные в cTrader Store, включая торговых ботов, индикаторы и плагины, предоставляются сторонними разработчиками и доступны исключительно в информационных и технических целях. cTrader Store не является брокером и не предоставляет инвестиционные консультации, персональные рекомендации или какие-либо гарантии будущей доходности.
Больше от этого автора


Цена
86.22M
Торгуемый объем
1.92M
Выигранные пипы
3.58K
Бесплатные установки