
Compare Symbol
Chỉ báo
200 lượt tải
Phiên bản 1.0, May 2025
Windows, Mac
Mô tả
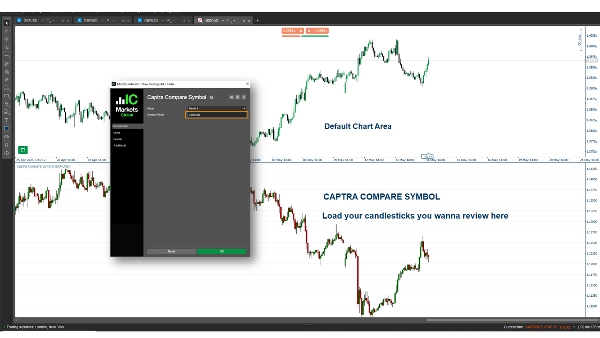
Captra Compare Symbol là một chỉ báo cTrader hiển thị giá đóng cửa và vẽ các cây nến (bấc, thân) cho một ký hiệu được chọn, như EURUSD, trên biểu đồ. Nó hỗ trợ nhiều khung thời gian khác nhau (ví dụ: 5M, 15M, 1H, Hàng ngày) với các hình ảnh có thể tùy chỉnh, sử dụng giá mở/cửa/đỉnh/đáy để thể hiện chính xác.
Tóm tắt
Tóm tắt AI
Captra Compare Symbol is a cTrader indicator that visualizes price data of a selected trading symbol, such as EURUSD, directly on the chart. It plots the close price and renders candlesticks—including wicks and bodies—using open, high, low, and close prices for precise representation. The indicator supports multiple timeframes, including 5-minute, 15-minute, 1-hour, and daily intervals. Visual elements are customizable to fit user preferences. This tool enables traders to compare the price action of an additional symbol alongside their primary chart, facilitating multi-symbol analysis within the cTrader platform.
Hồ sơ chỉ báo
Đánh giá của khách hàng
0.0
Đánh giá: 0
Đánh giá của khách hàng
Sản phẩm này chưa có đánh giá nào. Bạn đã dùng thử chưa? Hãy là người đầu tiên chia sẻ với mọi người!
Thảo luận
Câu hỏi thường gặp
EURUSD
Các sản phẩm có sẵn trên cTrader Store, bao gồm bot giao dịch, chỉ báo và plugin, được cung cấp bởi các nhà phát triển bên thứ ba và chỉ nhằm mục đích cung cấp thông tin và tiếp cận kỹ thuật. cTrader Store không phải là nhà môi giới và không cung cấp lời khuyên đầu tư, khuyến nghị cá nhân hay bất kỳ đảm bảo nào về hiệu suất trong tương lai.
Sản phẩm khác của tác giả này


Giá
86.67M
Khối lượng đã giao dịch
1.99M
Pip đạt được
3.67K
Cài đặt miễn phí