
High TF Plotter
Chỉ báo
435 lượt tải
Phiên bản 1.0, May 2025
Windows, Mac
4.6
Đánh giá: 3
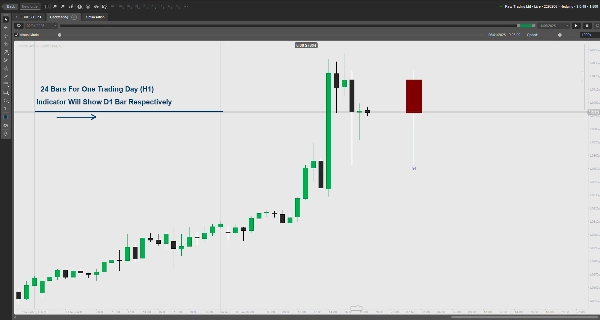
Vẽ hành động giá TF cao trên biểu đồ TF thấp hơn. Hiển thị mở/đóng, bóng nến và các vùng chính với màu bò/bear. Có thể tùy chỉnh.
Tính Năng Chính:
- Chồng hành động giá khung thời gian cao (ví dụ: Hàng ngày) lên biểu đồ khung thời gian thấp hơn.
- Hiển thị các hình chữ nhật giá mở/đóng với màu bò/bear có thể tùy chỉnh.
- Làm nổi bật các vùng ưu đãi/chiết khấu bóng nến cho các mức giá chính.
- Cấu hình khoảng cách lề cho biểu đồ.
- Xử lý lỗi cho các thiết lập khung thời gian không hợp lệ.
Vui lòng để lại đánh giá để cho chúng tôi biết nếu nó hữu ích.
Hồ sơ chỉ báo
4.6
Đánh giá: 3
5 | 67 % | |
4 | 33 % | |
3 | 0 % | |
2 | 0 % | |
1 | 0 % |
Đánh giá của khách hàng
January 27, 2026
It would have been very helpful if it were possible to configure the time for NY EST
August 18, 2025
Clear higher timeframe level plotting, customizable, lightweight. Cons: No auto-labels, no multi-timeframe overlays, no alerts.
May 29, 2025
Muito bom, mas se tivesse a linha de abertura, máxima e mínima seria perfeito. Obrigada.
Các sản phẩm có sẵn trên cTrader Store, bao gồm bot giao dịch, chỉ báo và plugin, được cung cấp bởi các nhà phát triển bên thứ ba và chỉ nhằm mục đích cung cấp thông tin và tiếp cận kỹ thuật. cTrader Store không phải là nhà môi giới và không cung cấp lời khuyên đầu tư, khuyến nghị cá nhân hay bất kỳ đảm bảo nào về hiệu suất trong tương lai.
Sản phẩm khác của tác giả này


86.17M
Khối lượng đã giao dịch
1.91M
Pip đạt được
3.57K
Cài đặt miễn phí