
Bar Explosion
Indicador
204 descargas
Versión 1.0, May 2025
Windows, Mac
Descripción
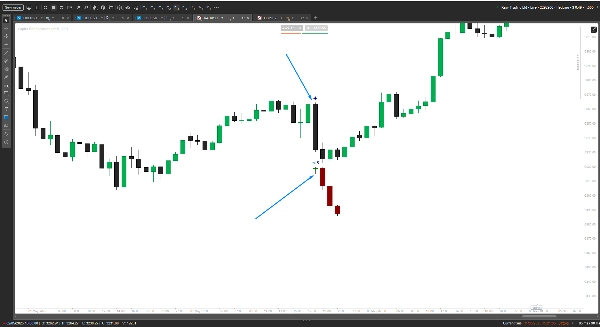
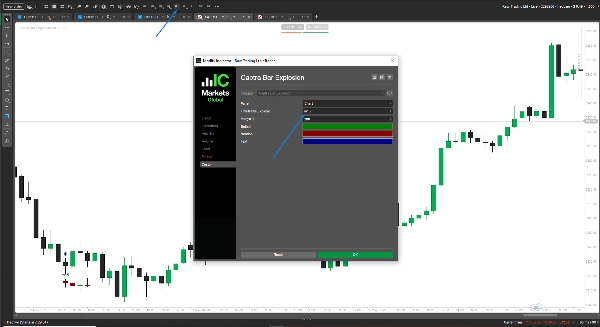
Desata el poder de Captra's Bars Explosion, un indicador de cTrader de primera categoría diseñado para dominar tu juego de trading. Esta bestia superpone explosivas visualizaciones de velas en mini-marcos temporales, permitiéndote detectar tendencias con precisión afilada como una navaja. Personaliza el marco temporal (por ejemplo, Minute15), los colores (Alcista/Verde, Bajista/RojoOscuro) y los márgenes (por defecto 30 pips) para adaptarlo a tu estilo. Perfecto para scalpers y traders de swing, está construido para cTrader con un rendimiento fluido.
Por favor, deja una reseña para hacernos saber si te resulta útil.
Resumen
Resumen de IA
Bar Explosion is a cTrader indicator that overlays mini-timeframe candlestick visuals onto your main chart, enabling precise trend identification. Users can customize the indicator’s timeframe (e.g., 15 minutes), colors for bullish (green) and bearish (dark red) bars, and margin settings (default 30 pips) to suit different trading styles. Designed for scalpers and swing traders, it provides detailed, smaller timeframe bar information directly on higher timeframe charts, enhancing market analysis without switching views. The indicator is optimized for smooth performance within the cTrader platform.
Perfil del indicador
Valoraciones de clientes
0.0
Valoraciones: 0
Valoraciones de clientes
Este producto todavía no se ha valorado. ¿Ya lo ha probado? Sea el primero en informar a otros.
Conversación
Preguntas frecuentes
Los productos disponibles a través de cTrader Store, incluidos bots, indicadores y plugins para operar, son proporcionados por desarrolladores de terceros y están disponibles únicamente con fines informativos y de acceso técnico. cTrader Store no es un bróker, por lo que no proporciona asesoramiento de inversión, recomendaciones personales ni ninguna garantía de rentabilidad futura.
Más de este autor


Precio
86.22M
Volumen operado
1.92M
Pips ganados
3.58K
Instalaciones gratis